While researching a dividend paying stock should be a holistic process and buying decisions shouldn't be based on any single metric, if there's one metric that every dividend investor should know, it's free cash flow cover.
After all, an income investing strategy doesn't work without income, so before you purchase any dividend stock, it's absolutely critical to know whether or not the dividend is sustainable. That is, can the company afford its current dividend through cash flows from operations?
You also want to know whether or not the company can grow its dividend in the coming years.
Get to know free cash flow
Free cash flow cover can help you answer both in ways that other common dividend analysis metrics -- earnings cover, various balance sheet ratios, etc. -- cannot.
Many companies and investors primarily focus on earnings cover (earnings per share/dividends per share or net income/dividends paid). As such, earnings cover is also important to consider, but "earnings" are simply an accountant's opinion of the company's profits and not necessarily a good measure of cash flow. In fact, a company can have sufficient earnings cover but negative free cash flow cover.
Because dividends are paid in cash, we want to use a metric that helps us measure cash inflows and outflows. That's what the free cash flow cover metric can do.
Free cash flow is how much cash flow is left over each year after the company has reinvested in its business. Think of it as spare or surplus cash flow. It's from these surplus cash flows that dividends, buybacks, debt repayments, etc. are funded.
Measuring free cash flow cover
Fortunately, free cash flow cover is a very simple metric to calculate and you only need to look at the cash flow statement to figure it out:
Free cash flow cover = (Cash from Operations - Capital Expenditures) / Dividends Paid
To illustrate the concept, let's have a look at Johnson & Johnson's most recent cash flow statement.
Source: Johnson & Johnson 2013 10-K filing (my highlights)
Using the three highlighted line items, we can determine that the free cash flow cover over the last three years has been:
2013: (17,414 - 3,595) / 7,286 = 1.90 times
2012: (15,396 - 2,934) / 6,614 = 1.88 times
2011: (14,298 - 2,893) / 6,156 = 1.85 times
(Note that sometimes companies will call capital expenditures "Additions to Property, Plant & Equipment" or something similar. It's all the same thing.)
As we can see, since 2011 Johnson & Johnson's free cash flow cover has been between 1.85 and 1.9 times.
Great, but is this a good ratio? Indeed it is, for it's telling us that for each $1 Johnson & Johnson pays out in dividends, it generates between $1.85 and $1.90 in free cash flow.
Dividend margin of safety
Free cash flow cover can be thought of as your dividend "margin of safety" or "margin of error" -- and, all else equal, the higher the ratio, the more secure you can consider the current payout and the more likely the dividend can grow in the future.
Conversely, a firm with a free cash flow payout ratio near or below 1 times has very little margin for error if it aims to maintain its current dividend. If it falls on a rough year, the dividend might be on the chopping block.
A company with low or non-existent free cash flow cover could support the payout for a while using alternative financing (borrowing, selling assets, etc.), but that's an unsustainable solution. Eventually, the firm will need to generate free cash flow from operations to support the dividend.
A good rule-of-thumb is to look for free cash flow cover above 1.5 times. As with any rule, there are exceptions and much will depend on the company's stage in its lifecycle and the stability of its business. A smaller firm that's still reinvesting large amounts in the business may have a very high free cash flow cover while a utility firm might reasonably pay out close to all of its free cash flow each year.
Still, I think any free cash flow cover below 1.5 times is worth further investigation. Does the company have other financial resources (a good balance sheet, etc.) to support they payout in the event of a bad year? Is demand for the business's products stable enough to sustain such a high free cash flow payout?
Bottom line
As I noted earlier, free cash flow cover shouldn't be the only metric you consider before buying a dividend stock, but it's the most important one to consider as it tells you the most about the company's dividend policy and generates many additional questions that need answering before an investment is made.
For this reason, free cash flow cover has the highest weight in my Dividend Compass rating system. You can download a copy of my Dividend Compass spreadsheet completely free by clicking here.
Once you're in the Google Doc, click File>Download As>Excel and you can begin customizing it.
All you need to do is enter the simple financial information found on the company's most recent annual report, click on the inputs tab, and see the company's Dividend Compass rating (5 being the best, 1 being the worst).
My apologies for having to manually enter the data. One day I'll get a data feed and have it automatically load with a change in ticker!
If you have any questions about free cash flow cover, the Dividend Compass, or dividend investing in general, please post them in the comments section below.
Prior to 1982, when large-scale share repurchases became viable after Congress enacted rule 10b-18, nearly all shareholder distributions were returned via cash dividends. As such, companies with longer operating histories tend to have a tradition of paying dividends and their shareholders have naturally come to expect them to continue. If given the chance, however, I suspect some of them would elect for a diminished dividend program in favor of buybacks, which offer substantially more financial flexibility and tend to benefit management and short-term investors. Consider the following chart, which shows the rolling three-year percentage of U.S. shareholder distributions made via cash dividends versus buybacks.
What's particularly notable is that this trend developed despite equal tax rates on dividends and long-term capital gains since 2003, an increasing number of retiring baby boomers seeking income over growth, and strong demand for higher-yielding stocks in a low rate environment. All of these factors should have encouraged a larger share of shareholder distributions going to cash dividends, but that's not happening. Some companies are clearly not comfortable with making a larger commitment to their dividend program. We can discuss the reasons this might be the case in the comments section below, but you might be rightly wondering at this point, "Why does this even matter?" As you're building a dividend portfolio, you want to stock it with companies that want to pay dividends. You don't want to own companies that feel burdened by their current payout, as these are the companies most likely to cut their payouts if given the opportunity. Here are five red flags that a company may not be comfortable with its dividend policy:
Token dividend increases: If a company's raising its dividend by a small amount each year (less than 4% growth), it might mean that it is cautious about its prospects, or it could mean that the company is simply raising its payout by a token amount to maintain a tradition of raising payouts. In either case, this is not an encouraging track.
High leverage and high payout ratio: Firms with high financial leverage that are also paying out the majority of free cash flow as dividends might be concerned about their ability to maintain the current payout. In the event of an economic downturn or a shock to their competitive environment, the dividend could come under fire. Keep an eye out for "token" dividend increases from such companies.
Excessive stock options in management compensation: The expected value of stock options decreases with the payment of dividends, so if the company's executive compensation program is heavily-weighted toward stock options, management may have a disincentive to paying higher levels of dividends.
Short-term focused ownership: If a friend or colleague offered you an opportunity to buy a small equity stake in a local business, one of the questions you'd surely ask is, "Who are the other owners?" You'd want to know how the other equity holders think about the business, are their interests aligned with yours, etc., yet it's amazing how infrequently this question is asked before investors purchase stocks. Take a look at the list of the company's largest shareholders (outlined in annual filings), check out the fund managers' websites, and try to determine if they're long-term and/or dividend-focused. If you see a bunch of hedge fund owners, you might want to walk away from the stock.
An increasing preference for buybacks: Though buybacks properly employed can support dividend growth, you want to see a balance between dividends and buybacks over time. If the company is shifting from a balanced approach toward more preference for buybacks, it's a warning sign that the company is losing enthusiasm for its dividend program.
As long-term, patient, dividend-focused investors, we want to own companies whose interests are aligned with our own. Recognizing the early signs of companies that are less committed to their dividend programs can help us better build our portfolios around the right companies.
Over the last two weeks, we've been searching for promising dividend growth stocks that trade on the U.S. markets. Our original objective was to identify "quality dividend-paying small- to mid-cap companies with sustainable competitive advantages and the potential for 7%+ annual dividend growth over the next 7-10 years." After running a broad screen to reduce the number of initial contenders, we put six companies through the Dividend Compass spreadsheet to get a better feel for the health of the companies' dividends. Of course, all of that work was based on historical data. Today, we'll dig deeper into the two finalists -- MTS Systems and WD-40 Company -- to determine how those names might perform going forward. Further, the research we've already done shows that both companies have solid balance sheets, are consistent generators of free cash flow, and have established good dividend track records. As such, we won't spend too much time digging into those data points today. Instead, we'll look at the two companies' competitive advantages (if they indeed exist), management quality, and consider their current valuations to determine whether or not they're worthy of investment right now. The finish line is in sight After digging into WD-40 and MTS this week, it's clear that the screening and Dividend Compass process uncovered two promising companies. Indeed, they check off a number of Peter Lynch's 13 signs of a perfect stock. Among them: little analyst coverage (officially, MTSC has two analysts, WDFC has four analysts), they each have a niche, and the companies are buying back stock (though this isn't always a great thing, in my opinion). As with most endeavors, the hardest part of the investing process is the last stretch. Most investors go through the screening process and read historical financial statements. Where you can separate yourself as an investor is in this last stretch of research -- digging for the qualitative factors and getting a feel for valuation.
MTS Systems (MTSC)
What does the company do?
MTS Systems supplies test systems and industrial sensors to a number of end-markets such as the automotive, aerospace, fluid power, and manufacturing sectors (i.e. mostly cyclical industries). About 80% of revenue comes from the test segment, which designs force and motion systems for determining a new product's mechanical properties; MTS commands a 16% market share of the global testing product and service industry. The sensors segment helps customers improve the efficiency and safety of their automated manufacturing processes and also measures fluid displacement and liquid levels; MTS has a 6% share of the global sensors market.
Source: MTS
MTS also has a wide geographical reach, with an established presence in the world's major manufacturing centers.
Source: MTS
Does it have sustainable competitive advantages?
Historical financials seem to suggest that MTS has a sustainable competitive advantage. It may lie in the "mission critical" nature of its products. Firms investing many millions of dollars in large industrial products simply cannot afford to forgo strenuous mechanical and fatigue testing before rolling the new product out to customers. The warranty or recall risk from a flawed piece of equipment may well outweigh the testing cost. Further, some products may be required to undergo such testing due to government regulation. But these could simply be industry-level advantages rather than a specific advantage to the firm.
Where MTS may set itself apart is with its established brand and reputation in the industry for doing quality testing, particularly for larger-scale projects. I'd imagine that most smaller-scale product testing can be done internally and that the competition for smaller-scale projects is pretty fierce. Larger-scale testing projects can last up to three years, however, and there are probably only a few companies that can handle such work -- MTS being one of them -- and customers are unlikely to switch providers halfway through the testing period. As such, I'd say MTS has a slight advantage stemming from switching costs for larger projects, but the depth of the moat will fluctuate along with demand for these larger-scale projects.
How about management?
The MTS leadership team is relatively new, by which I mean less than two years in their roles. It seems a few years ago that the company got in a little trouble regarding some disclosure items relating to government contracts. This appears to have been one of the primary drivers behind the August 2011 resignation of the former CEO and the re-shuffling of the executive suite. Such dramatic moves are necessary when there's been an ethics issue, but it also likely means that the company will be in transition mode for a few years. Unless you know a lot about the new management team (I don't) and the effect the changes are having at the ground level (again, I don't), it's hard to make a bold turnaround call (so I won't).
Short-term cash bonus metrics are based on EPS, EBIT, revenue, and orders. Not my favorite set of metrics, but not terrible given that MTS remains squarely in the growth stage of its lifecycle. In time, I'd prefer to see less emphasis on top-line growth and more emphasis on free cash flow and profit growth.
Biggest concern?
With 40% of testing orders coming from Asia, I have some concerns regarding the Chinese economy -- specifically, how the shift from an investment- and manufacturing-driven economy to a customer-driven one may affect demand for MTS's testing services in the region. MTS aims to double its revenue to $1 billion by 2018 and robust demand from the Chinese market will likely be necessary to achieve that goal.
Is it a good buy today?
MTS's average return on equity over the last five years is about 18% and its dividend policy is to pay out approximately 30% of earnings, implying a back-of-the-envelope sustainable growth rate of between 12-13%. Not bad against a P/E ratio of 18.6 times (~1.5 PEG), but not a slam dunk, either.
Doing some DCF work on MTS with a range of reasonable growth assumptions, I'd put a base case fair value near $60 per share, which is in-line with today's market price. I'd need a margin-of-safety of at least 20% with this type of business, so a good entry point might be closer to $48.
MTS is definitely a good one to watch in the event of a market pullback and there's significant dividend growth potential, but given my uncertainty around its sustainable competitive advantages and a newer management team, I wouldn't make it more than 2% of my portfolio.
WD-40 Company (WDFC)
What does the company do?
Anyone who's spent time in a garage, fixing squeaky hinges around the house, or worked on bicycles has likely used a WD-40 product. In fact, the vast majority of the company's revenues are based on the original WD-40 formula (WD-40 stands for “Water Displacement perfected on the 40th try”) and the company's documented over 2,000 uses for the secret formula. The company also owns a number of related consumer/industrial cleaning products such as Lava soap and X-14 mildew stain remover. Its products are sold in 187 countries, so the company does have a wide geographic reach (about 40% of sales are U.S.-based).
Does it have sustainable competitive advantages?
For starters, the WD-40 brand name is extremely valuable. I can't even name a substitute product. It's a trusted brand, can charge a premium price, and I'd even argue that there's a slight emotional connection to the brand (i.e. "this is the brand that my dad always used in the garage"). Beyond the brand, the company's ability to build upon a single secret formula and create multiple products is an example of economies of scope. This results in a cost advantage that would-be competitors would struggle to match if they attempted to go head-to-head with WD-40 on a certain product line.
Source: WD-40
The company's ability to consistently generate double-digit returns on capital is another indication that an economic moat is likely present. Finally, another telling statistic: in 2012, WD-40 generated nearly $1 million in revenue per employee. I like to see at least $250,000 in revenue per employee, so this is definitely a sign of a strong company.
How about management?
One thing that I really like about WD-40's management team is that all seven corporate officers been with the company for more than 15 years. My personal preference is for the companies I own to promote from within and to have a deep bench of talent in the event an executive leaves or retires. This is particularly true for a company with a strong corporate culture, as it supports cultural continuity. Now, a company with a rotten corporate culture may need to hire an outsider to shake things up, but all else equal I prefer internal promotion in the executive suite.
CEO Garry Ridge has been with the firm since 1987 and the CEO since 1997. During his tenure, the stock is up 319% cumulative, or about 9.2% annualized, compared to a 200% gain, or 6.9% annualized, for the S&P 500 over the period. The stock's also outperformed the S&P 500 by about 40 percentage points over the last five years. All this is to say that long-term shareholders should be fairly happy with the way the company's performed under Ridge's leadership. WD-40 also keeps the chairman position separate from the CEO role, which is textbook best practice for corporate governance.
I'm not crazy about management's bonus incentives, which are primarily linked to EBITDA. EBITDA is one of my least favorite financial metrics (Buffett called trumpeting EBITDA a "pernicious practice" in the 2002 letter; Munger called it "(expletive) earnings") because interest, taxes, and depreciation are natural and recurring shareholder expenses that shouldn't be ignored. I could rant on about EBITDA, but I'd much prefer this otherwise high quality company to use more shareholder-focused incentive metrics such as net income, free cash flow, and/or economic value added (EVA).
Biggest concern?
A potentially limited growth runway. With its products already in 187 countries and a sizeable portfolio of products already built around the WD-40 brand, what will drive top-line growth in the medium-term? I have no doubt that consumers will continue to buy WD-40, but can the company deliver high-single digit/low-double digit earnings growth without becoming more active on the M&A front?
Is it a good buy today?
WD-40's consistency and high quality hasn't been overlooked by the market and the stock has historically traded at a premium. WD-40's five-year average P/E is 19.1 times versus 17.2 times for the S&P; today it's trading at 22.7 times. Not exactly cheap on that basis. But what about growth? Based on the company's five-year average return on equity near 19% and its dividend payout ratio near 50%, the "sustainable growth rate" is about 9-10%. An implied PEG ratio near 2x isn't great, either. Its current dividend yield of 2.1% is also well-below its five year average closer to 3%.
Running a quick valuation on WD-40, I put a fair value on the shares at $52 (currently $58.52). I'd look to buy with at least a 15% margin-of-safety, so a good buy-around price today would be $44.
I really like WD-40 as a company. Hopefully the EBITDA-based incentive metrics go away, but otherwise I'd be happy to own WD-40 in the event of a market pullback. Ideally, I'd like to pick up the stock with a yield closer to 3%, which is about what I'd get if the stock traded near $44.
Bottom line
MTS Systems and WD-40 are both intriguing dividend growth candidates, but neither appears to be a good value at the moment. MTS has more dividend growth potential than WD-40, but also carries more risk.
All in all, I think this was a worthwhile exercise. We dug into two promising dividend growth opportunities and now have two good names to keep on our watchlists.
What do you think? Please let me know in the comments section below. Note: I switched the comments format back to the normal setting as the Google+ format was simply not working well. You can also reach me @toddwenning on Twitter.
Last week, we set up a simple stock screen with an objective of "Identifying quality dividend-paying small- to mid-cap companies with sustainable competitive advantages and the potential for 7%+ annual dividend growth over the next 7-10 years." We then employed a five-minute "sniff" test to determine which of the companies deserved a closer look. This week, I ran each of last week's six surviving stocks through my Dividend Compass* spreadsheet (free to use and download) in order to get a better feel for the companies' underlying dividend fundamentals. Of this group of six, I'll choose 2-3 for a deep-dive (competitive analysis, valuation, etc.) in next week's post. If they end up being good buys right now, I'll put some money into them. If not, I'll keep them on my watchlist. The results, please... Here's how each of the six companies fared on the Dividend Compass (scores out of 5):
*Used 3 year average due to shorter dividend history
Computer Programs & Systems: CPSI has the highest yield of the lot and scored very well in most of the Dividend Compass categories. It fell short where it counted, however, particularly in the dividend cover categories. Over the last five years, for instance, CPSI scored either a 1 or 2 in free cash flow cover -- the highest-weighted factor. Earnings cover was just slightly better. CPSI also held its quarterly dividend at $0.36 per share between February 2006 and November 2011. Combine these findings and it seems like CPSI has generally lived on the edge with its dividend payout.
The debt-free balance sheet is attractive and I give the company credit for not cutting its dividend during the financial crisis, but the consistent lack of dividend cover makes me a little nervous for a high-yield stock, let alone a dividend growth stock. A year or two of bad results and the dividend could be at risk. At best it would be held steady, which isn't an ideal scenario for a dividend growth investment.
Quality Systems: QSII's stock is up nicely over the last two months, but it has dramatically underperformed the S&P 500 to the tune of 80+ percentage points over the last two years. The dividend has also been held at $0.175 per quarter since March 2011. In short, something isn't quite right here. Underlying dividend health has also deteriorated as margins and returns have suffered over the last eighteen months. Though the five-year average score is decent, recent results are reason for concern.
Compass Minerals: One of the reasons that I look at multi-year scores is that some companies are in cyclical industries and results in a given year may not be representative of the company's dividend health. Compass Minerals is one such company, as much depends on the severity of winter weather in North America (for the salt business) as well as potash pricing. In good years, the dividend is well-covered by free cash flow and the balance sheet looks pristine, but dividend health deteriorates a bit in down years. Over time, however, the 3.91 of 5 score on the Dividend Compass is pretty good. I have some concerns about the changing competitive dynamics within the potash industry, but as a current shareholder I have long-term confidence in the business's prospects. Innophos Holdings: Having IPO'd in 2006, chemicals company Innophos has a fairly short dividend track record that begins in January 2007. Further, its quarterly payout was held steady at $0.17 per share from April 2007 to January 2011, but has since increased at a decent clip. The nearly four-year hiatus from dividend growth is a definite negative, but the other dividend health metrics have been consistently strong. Over the past twelve months, however, profit margins and returns on capital have been disappointing, so if Innophos passes onto the next round I'll need to figure out if this is a temporary issue or the start of a bad trend. WD-40: As I mentioned in last week's post, WD-40 is a company that I've had my eye on for some time. I really like the corporate culture -- the company has near-perfect employee reviews on glassdoor.com -- and it has over 100,000 members in the WD-40 Fan Club. The company scored a little below what I had expected on the Dividend Compass, dragged a bit lower by underwhelming dividend growth over the last three years. Instead, the company has increased its buyback activity, which I'll need to look into further if I pass the company into the next round. MTS Systems: Of the six companies that made it to this round, MTS Systems had the highest Dividend Compass marks including an almost perfect score in calendar year 2012. The 1.9% dividend yield is a bit pedestrian, but the balance sheet is very strong and the company has generally produced more than enough free cash flow to cover the dividend while increasing its payout over time. I do have a few concerns about recent performance that will need to be addressed if MTS Systems proceeds to the final round.
Who made the cut?
The Dividend Compass revealed a lot about each stock in about 10-20 minutes, which I think saved a good deal of time by not needing to spend an hour-plus reading through each company's annual reports. By not having to conduct a deep-dive on six companies, I can now focus on 2-3 names in the next round.
I'm not putting CPSI through to the next round. Even though CPSI had the highest yield of the group, I simply can't get past the consistently-low dividend cover.
CMP is a very well-run company and I believe it is an attractive candidate for further research, but because I already have a position in the company and want to learn more about recent developments in the potash industry, I'm going to hold off on doubling-down on it.
QSII might be a really interesting research subject from a value/turnaround opportunity standpoint, but the fall-off in margins and returns over the last eighteen months makes me concerned that there's been a significant change to the competitive dynamics within the industry. The recently-stalled dividend growth also gives me pause. As such, I'm not putting QSII through to the next round.
I'm also not moving forward with IPHS on account of its relatively short and unproven dividend track record, but its DC numbers were good and I'd definitely consider looking into it down the road.
I started out thinking that WDFC would be a sure-thing to make it into the final round, but I was disappointed with its score on the DC. I went back-and-forth on this one a bit, but decided to pass it through to the next round as I think it's a fascinating company to discuss. One of the key research topics will be why dividend growth hasn't been as robust as it perhaps could have been in recent years.
MTSC's strong DC scores were a nice surprise and I'm also going to put it through to the final round. Results have been a little shaky recently, but we'll figure out next week if those are temporary issues or not.
Low yields
Both companies' yields are around 2%, which isn't much to write home about, but the yields are comfortably above the Russell 2000 yield of 1.4%, and at first glance, both businesses appear to have the potential for 7%-plus dividend growth over the next decade. At the very least, they're worthy of further research.
In the concluding post of this three-part series, we'll take a much closer look at WDFC's and MTSC's businesses and do some valuation work on them, as well.
Thanks for reading and please post any comments, questions, or criticisms below. You can also contact me on Twitter @toddwenning or by email here.
*Frequent users of the Dividend Compass will note that I have recently blocked out a few of the input categories from 2004-2006. Those data points don't have an effect on the Dividend Compass scoring system and I wanted to eliminate some of unnecessary fields. Please let me know if you have feedback on this.
There's no question that dividend-paying stocks have become more popular in recent years as interest rates on fixed income and savings products declined.
Indeed, dividend-focused ETFs and mutual funds have experienced strong inflows, some higher-yielding stocks in rather staid industries (tobacco, utilities, etc.) are trading with multiples above their five-year averages, and gross S&P 500 dividend distributions will almost certainly hit a record high in 2012.
Contrarian investors will naturally raise an eyebrow or two at these developments.
Time to bail?
The heightened interest in dividends has led to some speculation that a "dividend bubble" might be afoot. As you might expect, massive debate has ensued among pundits, normally with the author taking a firm and uncompromising stance on one side or the other.
The problem isn't that either side hasn't made fair observations, but that the debate is all too frequently framed around whether or not there is in fact a "bubble" -- definitely the most overused term in financial media -- and misses the fruitful middle ground, leaving the reader without any actionable guidance ("Great, there is/isn't a dividend 'bubble'. What now?")
Instead, I find it far more instructive to critically examine the landscape as it stands today without being handcuffed to the bubble framework.
Is there "irrational exuberance" for dividend-paying stocks today? Relative to the exuberance we saw with dotcom stocks or housing, absolutely not. If there were, I don't think you'd see this trend in U.S. payout ratios.
Aswath Damodaran, Standard & Poors
It stands to reason that if investors really were falling over themselves to buy dividend stocks, companies would respond by paying out a greater percentage of earnings as dividends, so as to attract more investor interest. While some companies may have accelerated their dividend payouts for this reason, on average, that's not happening.
Instead, S&P 500 companies used buybacks over dividends to return cash to shareholders by nearly a 2:1 ratio in the second quarter. The trailing 12-month S&P 500 dividend payout ratio stands at just 32%.
Source: Standard & Poors
Might some institutional investors be using buybacks to 'create' their own dividends? Maybe, but you could have just as easily have made the case for that in 2007 when dividends certainly weren't in style.
And yes, aggregate dividends of $67.31 billion in Q2 2012 set a record -- finally eclipsing the previous record of $67.09 billion set in Q2 2007. Flat nominal dividend growth over the course of five years is hardly an indication that corporations are opening the spigots to satiate investor appetite for dividends.
Are some dividend-paying stocks overvalued today? Yes. Judging by the multiples on some low-growth, high-yielding stocks today, I think it's likely that income-thirsty investors have in some cases reached for yield and bid the share prices above their fair value.
Similarly, so-called "quality" dividend-paying stocks -- that is, stocks with long track records of raising payouts each year (Aristocrats, Achievers, etc.) and investment-grade balance sheets -- as a group seem to be fully valued.
Are all dividend-paying stocks overvalued today? No. I think there's likely more value to be found in the lower-yielding areas of the market, as investors who are solely interested in current income are focused on the higher-yielding stocks and may not have the time horizon or interest to wait for the dividend to grow over time.
Where might there be value left among dividend-paying stocks? Investors who have just started building a dividend-focused portfolio are not likely to find many deep value opportunities in the high-yield or traditional "quality" space right now.
The most fertile ground for moderate- to high-yielding stocks today is likely found in stocks that have just recently started paying dividends (as they're not yet included in Aristocrat/Achievers screens and trackers), stocks that may have cut their payouts during the financial crisis but are on the path to recovery, and in smaller-cap stocks where the large funds are less likely to hunt for yield.
Bottom line
While there isn't a dividend "bubble", I will say that most of the low-hanging fruit has been picked. As such, you'll need to do a little extra homework if you hope to land some undervalued dividend-paying stocks with relatively good yields right now. It's no longer as simple as picking 12-20 stocks that everyone knows with investment-grade balance sheets and decades-long dividend track records. Yet there are still opportunities out there for investors willing to do the extra work.
(If you need a little help analyzing the stocks you come across, my free Dividend Compass tool can help you with your research.)
As always, stay disciplined and patient out there.
In the U.S. and U.K. markets, the most common form of dividend policy is one that aims to pay at least the same amount year after year, regardless of the company's performance that year. I'll call this the "consistent" dividend policy.
In such a system, a dividend increase is typically seen as a positive thing -- a sign that the company expects profitability to improve in coming years. Conversely, a dividend cut is usually a negative -- a sign that the company has run into trouble and needs to shore up cash.
Indeed, a number of companies have run into trouble desperately trying to maintain the historical dividend level -- borrowing, selling assets, etc. -- when the logical thing to do would have been to reduce the dividend payout until things got better.
An alternative approach is the "flexible" payout policy in which a company establishes that it will pay a certain percentage of earnings or free cash flow each year. The payout amount could fluctuate up and down, but it relieves the company of having to worry about maintaining a certain payout each year.
I see benefits and drawbacks to both approaches. In the end, I think it depends on the nature of the company's business and the precedent that it has set with shareholders.
U.K.-based Rotork, for example, operates in a cyclical industry and smartly implements a flexible dividend policy that incorporates a "core" dividend that grows in line with earnings plus an "additional" dividend in particularly good years. If the company runs into a bad year, the total payout may be lower than the previous year, but shareholders will likely be more accepting of that since the policy has been clearly communicated and consistent.
On the other hand, Procter & Gamble (a stock I own) operates in a more defensive industry and has paid an increasing dividend for 56 years. As such, its shareholders expect a consistent (and rising!) payout each year. A lower dividend would be disastrous signal.
All that said, many large companies with consistent dividend policies also practice flexible distribution policies -- it's just that they substitute buybacks for cash dividends to bridge the gap. In other words, they maintain a consistent dividend policy and adjust to the business climate using buybacks.
As the chart below shows, since 1999 the modified payout (dividends + buybacks) has fluctuated quite a bit, but the median modified payout has been about 82%.
Source: Standard & Poors
U.S. companies are paying out most of their earnings over the business cycle, just not with dividends -- the median dividend payout ratio over the period is 35% with the balance going to buybacks.
If anything, then, investors who prefer a flexible dividend policy should be demanding that companies use a greater percentage of actual dividends in their distribution policies (i.e. a normal + special dividend policy). I think there's a good case for that.
What's your take? Have a suggestion for future posts? Please post your comments below.
When it comes to equity analysis, a lot of attention is paid to valuation -- and rightly so, as your investing career will likely be a short one if you consistently overpay for assets.
Surprisingly, however, there's typically little attention paid to dividend analysis, which usually begins and ends with a glance at the dividend payout ratio (or dividend cover). As long as the company is earning more than it's paying out, the thinking goes, all is well with the dividend; conversely, if the company is paying out about the same amount as (or more than) it's earning, the dividend is at risk.
There's more to it
While the payout ratio is important, in my experience, the main causes of a dividend cut are factors other than a high dividend payout ratio (or low dividend cover). Indeed, a high payout ratio is usually the result of past events and trends that have been in place for a number of years.
In fact, more times than not, the need to strengthen the balance sheet is the cited reason for a dividend cut -- creditors and ratings agencies get worried about a lack of cash flow and large dividends become an easy target for freeing up cash. In turn, a weak balance sheet is often the result of a deterioration in business strength over a number of years -- margins have contracted, growth has slowed, and free cash flow has dried up -- paired with over-borrowing or over-spending.
Early diagnosis is the key
So rather than just look at the dividend payout ratio, it seems prudent to take a more holistic approach to dividend analysis by considering other factors that contribute to dividend health, such as:
Sales growth: Sales are the life-blood of a company. If sales are drying up, that puts added pressure on profits and cash flows and thus the dividend, too.
Interest coverage (EBIT/interest expense): If a company is having trouble paying the interest on its debt, there's a greater chance that its creditors will get worried and raise the company's cost of borrowing, which could reduce net income. In a worst-case scenario, the dividend could be cut to accelerate the repayment of principal.
Net debt/EBITDA: This is a common measure ((Debt-Cash)/EBITDA) that creditors and ratings agencies use to determine credit quality and it's commonly used as a metric in debt covenants. A firm that has borrowed too much or is struggling to pay down its debt relative to its profitability is more likely to have a risky dividend.
Dividend growth rate: A slowing dividend growth rate could be a sign that the company is less confident in its future growth potential. Eventually, all companies' dividend growth rates decline, but you want to see a steady decrease over many years and not a sharp drop.
Earnings cover: Even though I don't think it's the best measure of dividend health, earnings cover (Net Income/Dividends Paid) remains the most common metric cited by both companies and investors alike, so it should be considered in any dividend analysis.
Free cash flow cover: Free cash flow cover ((CFO-CapEx)/Dividends Paid) is a better measure of dividend health than earnings cover because companies don't pay out earnings -- they pay out cash. As such, I'd rather look at a company's cash flows than net income.
Operating margin: A company whose margins are contracting could be facing increased competitive pressures or becoming less efficient. When this occurs, less money falls to the bottom line and to cash flows and the dividend can become riskier. Cyclical companies' margins will naturally ebb and flow. In those cases, use rolling 5-year margins to account for the business cycle.
Return on equity: Companies that are unable to sustainably generate returns above their cost of equity are likely destroying shareholder value and usually have lower growth potential. Neither are good things from a dividend perspective.
Dividend Compass Tool
With this framework in mind, I tried my hand at a new (and hopefully improved) spreadsheet model for rating the health of a company's dividend. I'm calling it the Dividend Compass, and you can access and download it for free by clicking here.
(It's hosted on Google Docs for sharing purposes, but you can download it
to Excel by clicking on File>Download As>Excel on the top left
hand corner of the Google Docs page. Once you've downloaded it, you can make changes. If something doesn't work, please let me know in the comments section below.)
To get started, all you need to do is enter a few years' worth of key financial datapoints (sales, debt, etc.) -- all publicly available data -- on the Inputs tab and then click on the Dividend Compass tab.
The Dividend Compass (DC) will rate the company's dividend health based on metrics derived from your entries, with a 5 being a perfect score and 1 being the lowest. The overall score is based on the weighted average scores of the eight metrics and the default weights are based on what I believe to be the most important metrics. You can change them to fit your approach as long as they sum to 100%.
The DC will also grade the dividend going back a few years and provide a 5-year average score that will help you identify trends in the dividend's health. A falling score in any of the categoreis, for instance, may indicate a trouble spot that's worth looking into.
A few things to remember
I can't stress enough that the DC should not be used as a buy/sell indicator nor is it meant to be the final word on any stock. It's simply a research tool to help you tell the difference between a healthy dividend from a risky one, using a more holistic approach than traditional methods. Further research is always necessary before making a trading decision.
Dividend yield is not included as a graded metric in the DC. All else equal, I would expect higher yielding names to have lower scores and vice versa.
Finally, the DC is still in early days, so if you notice a bug or see room for improvement, please post a comment below. Questions and criticisms are always welcomed, too.
Hope you had a nice weekend.
Best,
Todd
@toddwenning on Twitter
(long JNJ, the default example in the DC spreadsheet)
When Warren Buffett says of an investor's commentaries, "When I see memos from (him) in my mail, they're the first thing I open and read. I always learn something, and that goes double for his book," that's a pretty good sign that you could learn something from the investor, too. Buffett is referring to Howard Marks, the chairman of Oaktree Capital, who writes regular investing commentaries on the Oaktree website (click here) and is the author of The Most Important Thing: Uncommon Sense for the Thoughtful Investor (2011). I've been a regular reader of Marks' commentaries for a few years, but somehow - regrettably - only picked up his excellent book this past week. If you're passionate about investing, it's a must-read.
This week I'd like to build upon a piece of advice from his book on the importance of building and keeping a watchlist of ideas:
The process of intelligently building a portfolio consists of buying the best investments, making room for them by selling lesser ones, and staying clear of the worst. The raw materials for the process consist of (a) a list of potential investments, (b) estimates of their intrinsic value, (c) a sense for how their prices compare with their intrinsic value, and (d) an understanding of the risks involved in each, and of the effect of their inclusion would have on the portfolio being assembled
Having a watchlist of potential investments next to your workstation allows you to more effectively seize upon opportunities presented by the sometimes-mercurial Mr. Market. Armed with a watchlist, the patient investor will be at an advantage as he or she can simply wait for good investments to arise rather than going out looking for them. But there's a difference between a good watchlist and one that you've scratched on the back of an old grocery shopping list (something I've been guilty of now and again) or keep locked up in your mind where it's sure to be forgotten or warped to fit your sentiment du jour. Fortunately, Marks provides us with the key criteria of a good watchlist -- namely a fair value estimate, a measure for margin-of-safety, and a risk assessment of each investment.
Trouble is, determining the intrinsic value for a stock can not only be a complex process, but it can also be very time-consuming. For individual investors that struggle to find time to research stocks between jobs, family time, and other pursuits, intrinsic value estimation can seem a futile endeavor. I reckon that's why many investors rely on rules-of-thumb (i.e. "buy only low P/E stocks") or tips heard from friends or in financial media when making investment decisions. It's a natural response to look for quick fixes when we're short on time, but if we hope to achieve superior investment results, it's essential that we find a way to consistently purchase securities below their fair value and -- perhaps more importantly -- to avoid investing in overvalued securities.
Listen to the market
While investing contains many uncertainties, we do have one objective piece of information to rely on -- the stock price. The stock price gives us an incredible amount of information about the market's active assumptions for a given security.
If we make the fair assumption that the intrinsic value of a security is the discounted value of its future dividend payments (Gordon Growth Model), know the latest annual dividend payment, and can make a reasonable discount rate estimate, we can determine the market's current growth assumptions for the dividend.
Where:
Current market price = (Dividend per share * (1+Growth)) ------------------------------------------------ Discount Rate - Growth
***You can also use next year's estimated dividend as the numerator
In other words, if a stock's market price is $100 per share, the latest annual dividend was $2 per share, and the appropriate discount rate is 10.5%, we can algebraically determine that the implied growth rate at that price by calculating:
In this case, the market's implied long-term dividend growth rate at $100 is 8.33%.
That's powerful insight to have as an investor. By estimating the market's implied growth rate, we can then determine whether or not the market's growth assumption is reasonable (therefore making the stock nearly-fairly valued), too high (overvalued), or too low (undervalued).
This leads us to yet another problem, though -- how do we know if the implied growth rate is reasonable, too high, or too low? That is the million-dollar question, of course. If it was an easy answer and everyone knew it, the stock would be perfectly priced because everyone would have the same assumption. Frankly, most of the time the market's estimate is fairly good, which leaves few opportunities to take advantage of mispricings. However, it's still worth determining your own growth estimate because every so often the market graces us with good buying and selling opportunities -- Mr. Market can quickly become a distressed seller offering fire-sale prices or can be euphoric and ready to offer you top-dollar for your stock. In those situations, the emotional Mr. Market pays little attention to reasonable growth estimates and is just looking to make a deal. And that's when the prudent investor should be ready to pounce.
One way to estimate a long-term growth rate is with the "sustainable growth rate" formula, which is simply:
SGR = Return on Equity * Retention Ratio Where: Retention Ratio = (1-dividend payout ratio), or (1-(1/dividend cover))
What this formula tells us is that if a company is generating a return on equity of 15% and is paying out 50% of its earnings in dividends, the 50% of its earnings that it's retaining can be reinvested in the business at 15%. The sustainable growth rate is therefore 15%*50% = 7.5%. This is the highest growth rate the company can generate without increasing leverage (increased leverage would, all else equal, increase ROE).
If we plug this 7.5% growth assumption into the previous example where the $100 market price was implying an 8.33% growth rate, it's possible that the stock is overvalued as the market could be overestimating the company's future growth. At the very least, it opens up some valuable questions to be answered with further research such as "Why might the market be pricing in higher growth -- is it a function of a higher potential return on equity, a higher retention ratio, or a combination of both?"
Getting started
Circling back to the point of these formula explanations, a simple DDM and SGR calculation can be effectively used in a watchlist of ideas by helping you determine a stock's intrinsic value. To get you started, I've created an example watchlist on Google Docs, which you can download (free, of course) by clicking here.
The "Watchlist" tab contains the key elements that Marks advocates in a good watchlist -- a fair value estimate, margin of safety, and risk factors. You'll need to enter the data points manually and update them often. (Click image to enlarge)
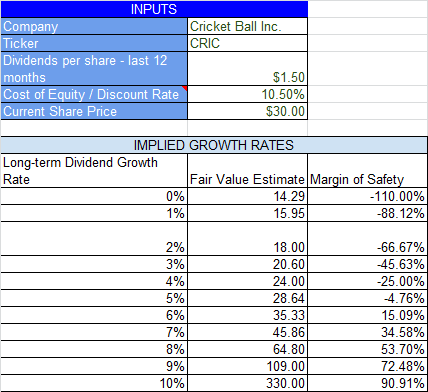
The "DDM Valuation" tab contains a DDM tool that can help you determine the implied dividend growth rate of a stock at various market prices. You only need to enter a few data points -- the current stock price, the trailing twelve month dividend payout, and an estimated cost of equity (for most large, stable companies a 10.5% cost of equity is a fair baseline assumption). In the default example, the $30 per share market price of Cricket Ball Inc. implies the market is pricing-in a long-term dividend growth rate near 5% assuming a 10.5% discount rate and given its $1.50 per share dividend last year. If Cricket Ball Inc. could grow its dividend at 6%, it might be worth $35 and at 7%, $46, and so on.
There's also a simple sustainable growth rate calculator on the "DDM Valuation" tab, which could help you determine a reasonable growth rate assumption for the stock you're researching. You'll need to input the 5 year average return on equity and the retention ratio. In the default example, Cricket Ball Inc.'s five year average ROE was 12.5% and it retained 55% of its earnings last year, which results in a sustainable growth rate of 6.88%. If Cricket Ball Inc. can indeed sustain a 6.88% growth rate, its fair value should be approximately $44 -- again assuming a 10.5% cost of equity -- and that would provide a 32% margin of safety at current prices near $30, making it a reasonable buying opportunity.
Proceed with caution
By no means is the DDM a perfect valuation model (it works best with stable companies with a history of dividend payouts) and the "garbage in, garbage out" rule applies as with any calculation, so be sure to double-check your data points for accuracy. I encourage you to combine the DDM results with other valuation methods to determine a range of possible values. The DDM can, however, provide some valuable insight into the market's current growth estimates and is a fairly simple way to get started with determining a stock's intrinsic value. At the very least, it's better than making buy/sell decisions with no grasp of intrinsic value, which would ultimately lead to poor investment decisions and subpar results.
I hope this discussion and sample watchlist will help you make better investment decisions. And do yourself a favor and buy Howard Marks' book! Let me know what you think of it.