Last week, we set up a simple stock screen with an objective of "Identifying quality dividend-paying small- to mid-cap companies with sustainable competitive advantages and the potential for 7%+ annual dividend growth over the next 7-10 years." We then employed a five-minute "sniff" test to determine which of the companies deserved a closer look. This week, I ran each of last week's six surviving stocks through my Dividend Compass* spreadsheet (free to use and download) in order to get a better feel for the companies' underlying dividend fundamentals. Of this group of six, I'll choose 2-3 for a deep-dive (competitive analysis, valuation, etc.) in next week's post. If they end up being good buys right now, I'll put some money into them. If not, I'll keep them on my watchlist. The results, please... Here's how each of the six companies fared on the Dividend Compass (scores out of 5):
*Used 3 year average due to shorter dividend history
Computer Programs & Systems: CPSI has the highest yield of the lot and scored very well in most of the Dividend Compass categories. It fell short where it counted, however, particularly in the dividend cover categories. Over the last five years, for instance, CPSI scored either a 1 or 2 in free cash flow cover -- the highest-weighted factor. Earnings cover was just slightly better. CPSI also held its quarterly dividend at $0.36 per share between February 2006 and November 2011. Combine these findings and it seems like CPSI has generally lived on the edge with its dividend payout.
The debt-free balance sheet is attractive and I give the company credit for not cutting its dividend during the financial crisis, but the consistent lack of dividend cover makes me a little nervous for a high-yield stock, let alone a dividend growth stock. A year or two of bad results and the dividend could be at risk. At best it would be held steady, which isn't an ideal scenario for a dividend growth investment.
Quality Systems: QSII's stock is up nicely over the last two months, but it has dramatically underperformed the S&P 500 to the tune of 80+ percentage points over the last two years. The dividend has also been held at $0.175 per quarter since March 2011. In short, something isn't quite right here. Underlying dividend health has also deteriorated as margins and returns have suffered over the last eighteen months. Though the five-year average score is decent, recent results are reason for concern.
Compass Minerals: One of the reasons that I look at multi-year scores is that some companies are in cyclical industries and results in a given year may not be representative of the company's dividend health. Compass Minerals is one such company, as much depends on the severity of winter weather in North America (for the salt business) as well as potash pricing. In good years, the dividend is well-covered by free cash flow and the balance sheet looks pristine, but dividend health deteriorates a bit in down years. Over time, however, the 3.91 of 5 score on the Dividend Compass is pretty good. I have some concerns about the changing competitive dynamics within the potash industry, but as a current shareholder I have long-term confidence in the business's prospects. Innophos Holdings: Having IPO'd in 2006, chemicals company Innophos has a fairly short dividend track record that begins in January 2007. Further, its quarterly payout was held steady at $0.17 per share from April 2007 to January 2011, but has since increased at a decent clip. The nearly four-year hiatus from dividend growth is a definite negative, but the other dividend health metrics have been consistently strong. Over the past twelve months, however, profit margins and returns on capital have been disappointing, so if Innophos passes onto the next round I'll need to figure out if this is a temporary issue or the start of a bad trend. WD-40: As I mentioned in last week's post, WD-40 is a company that I've had my eye on for some time. I really like the corporate culture -- the company has near-perfect employee reviews on glassdoor.com -- and it has over 100,000 members in the WD-40 Fan Club. The company scored a little below what I had expected on the Dividend Compass, dragged a bit lower by underwhelming dividend growth over the last three years. Instead, the company has increased its buyback activity, which I'll need to look into further if I pass the company into the next round. MTS Systems: Of the six companies that made it to this round, MTS Systems had the highest Dividend Compass marks including an almost perfect score in calendar year 2012. The 1.9% dividend yield is a bit pedestrian, but the balance sheet is very strong and the company has generally produced more than enough free cash flow to cover the dividend while increasing its payout over time. I do have a few concerns about recent performance that will need to be addressed if MTS Systems proceeds to the final round.
Who made the cut?
The Dividend Compass revealed a lot about each stock in about 10-20 minutes, which I think saved a good deal of time by not needing to spend an hour-plus reading through each company's annual reports. By not having to conduct a deep-dive on six companies, I can now focus on 2-3 names in the next round.
I'm not putting CPSI through to the next round. Even though CPSI had the highest yield of the group, I simply can't get past the consistently-low dividend cover.
CMP is a very well-run company and I believe it is an attractive candidate for further research, but because I already have a position in the company and want to learn more about recent developments in the potash industry, I'm going to hold off on doubling-down on it.
QSII might be a really interesting research subject from a value/turnaround opportunity standpoint, but the fall-off in margins and returns over the last eighteen months makes me concerned that there's been a significant change to the competitive dynamics within the industry. The recently-stalled dividend growth also gives me pause. As such, I'm not putting QSII through to the next round.
I'm also not moving forward with IPHS on account of its relatively short and unproven dividend track record, but its DC numbers were good and I'd definitely consider looking into it down the road.
I started out thinking that WDFC would be a sure-thing to make it into the final round, but I was disappointed with its score on the DC. I went back-and-forth on this one a bit, but decided to pass it through to the next round as I think it's a fascinating company to discuss. One of the key research topics will be why dividend growth hasn't been as robust as it perhaps could have been in recent years.
MTSC's strong DC scores were a nice surprise and I'm also going to put it through to the final round. Results have been a little shaky recently, but we'll figure out next week if those are temporary issues or not.
Low yields
Both companies' yields are around 2%, which isn't much to write home about, but the yields are comfortably above the Russell 2000 yield of 1.4%, and at first glance, both businesses appear to have the potential for 7%-plus dividend growth over the next decade. At the very least, they're worthy of further research.
In the concluding post of this three-part series, we'll take a much closer look at WDFC's and MTSC's businesses and do some valuation work on them, as well.
Thanks for reading and please post any comments, questions, or criticisms below. You can also contact me on Twitter @toddwenning or by email here.
*Frequent users of the Dividend Compass will note that I have recently blocked out a few of the input categories from 2004-2006. Those data points don't have an effect on the Dividend Compass scoring system and I wanted to eliminate some of unnecessary fields. Please let me know if you have feedback on this.
The most dangerous time to pick high-yield stocks is in the late stage of a bull market, which I believe we're in today. One of the oldest investment adages is that "bull markets climb a wall of worry" and that has certainly been true of this market. Despite all the various crises -- Greece, the Eurozone, fiscal cliffs, debt ceilings, Manti Te'o's girlfriend, etc. -- many major global markets are at or near five-year highs. From a dividend investor's perspective, however, it's precisely the worry that provides the opportunities to buy quality high-yield shares -- defined loosely here as companies with strong balance sheets, plenty of dividend cover, a good track record of raising dividend payouts, and sustainable competitive advantages -- at discounted prices. As markets rally and the worry dissipates, however, dividend yields naturally go in the opposite direction and the number of good opportunities dries up. Quality rallies early Consider the performance of the SPDR S&P Dividend ETF (SDY) -- which tracks the S&P High Yield Dividend Aristocrats Index -- versus the SPDR S&P (SPY) since the nadir of the financial crisis.
Source: Yahoo! Finance
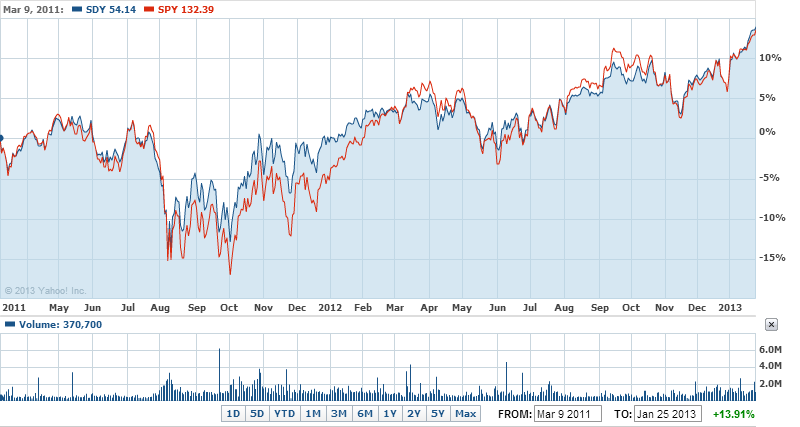
Just about neck-and-neck over the period, but let's take a look at how they performed in the two years after the low-point in the market:
Source: Yahoo! Finance
For most of this two year period, the SDY steadily outperformed the index. Eventually, however, the index caught up and they've been trading pretty much in-line ever since:
Source: Yahoo! Finance
Though the S&P High Yield Dividend Aristocrats Index may not be the perfect tracker of "quality" dividend stocks, I do consider it a fair proxy. As such, we can gather from this example that quality dividend payers got snapped up fairly quickly in this bull market. By early 2011, the Aristocrats index was likely trading at or near fair value. Once the quality names have been picked up in the early stages of a bull market, investors looking for a combination of high-yield and quality are normally left needing to compromise one for the other. This isn't to say there aren't special cases for investors to pick up quality high-yield names at a discount during a bull market -- markets can also overreact to a bad earnings report or temporary sector concerns -- but, as a whole, quality high-yield names are normally snapped up early on. Scraping the bottom of the barrel When examining a high-yield stock in this type of market, it's imperative to examine why the stock's yield remains well above the market average. If it possesses market-average risk and growth potential, it stands to reason that its yield should also approximate the market average and that investors should have bid up the stock price by now. If its current yield is still 2x the market average, then, it's probably a good indication that something is wrong with the underlying business -- either it has considerable risk factors or its growth outlook is quite meager. In either case, it probably can't be defined as a "quality" dividend payer. To further illustrate this concept, let's step into the way-back machine for a moment and travel back to early 2008, near the end of the previous bull market. At the end of 2007, the S&P 500 average dividend yield was 1.89% putting any stock over 3.8% firmly into the high-yield category (my rule-of-thumb is 2x the market average in the U.S.). I was able to find a helpful table of the highest-yielding Dow 30 stocks as of January 24, 2008 and examine their subsequent five-year dividend growth rates.
Source: CNBC.com, Yahoo! Finance; Altria dividend growth as of June 2008, post-PM spin off.
The dividend-based performance of these shares since the end of the last bull market is certainly mixed, with Altria being the stand-out star, especially when you factor in the performance of Philip Morris International over the period. AT&T and Verizon did reasonably well, too, but you certainly got what you paid for -- high-yield and low dividend growth. As for Pfizer, Citigroup, and GM...the numbers speak for themselves. A look at the highest-yielding stocks in the S&P 500 from around the same time is even more troubling, with a number of famous dividend blow-ups found therein. Granted, a good percentage of the 1,000+ dividend cuts by U.S. companies in 2008 and 2009 were financials and I don't expect another massive round of dividend cuts in the near future, but the principle holds true that investors should be very skeptical of the highest-yielding stocks in the late stages of a bull market as the "margin of safety" has shrunk considerably. A cautionary tale
If you've already built your dividend-focused portfolio, this may be a good time to review the highest-yielding names in your portfolio, but it isn't necessarily a screaming sell signal if you have a long time horizon and can afford to be patient. On the other hand, if you're starting to build a dividend-focused portfolio right now or are looking to add new names to your portfolio, proceed with caution when considering high-yield stocks.
As always, thanks for reading and please post any comments below or on our dividend investing community page on Google Plus.
First off, thank you to everyone who has already taken a look at the Dividend Compass spreadsheet (which you can view and download for free by clicking here).
If you haven't the faintest idea what I'm talking about -- a forgiveable oversight :) -- here's an earlier blog post that explains the Dividend Compass and how it works.
Also, a special thank you to those of you who have provided valuable feedback on the Dividend Compass -- in particular to Pablo, who noticed a broken formula that has since been fixed.
Since we're nearly finished with 2012 (hard to believe!), I've added a column for trailing-twelve month (TTM) figures so the data is as fresh as possible.
Roll up our sleeves
Today, I'd like to illustrate a few ways in which you can use the Dividend Compass to notice trends in dividend health and growth potential.
The default company in the Dividend Compass is Johnson & Johnson* (a stock I own), which also happens to be a great example for trend-spotting.
Here's how the Dividend Compass results tab looks today:
Setting aside the weights and final score aside for a moment and focusing on the line items, we can quickly recognize a few trends.
On the positive side, operating margins remain solid, the balance sheet (based on interest coverage and net debt/EBITDA) remains in excellent shape, and the dividend looks sustainable on a free cash flow cover basis.
Unfortunately, the negative trends appear to outweigh the positives. Sales growth, dividend growth, earnings cover, and return on equity have all declined by at least two full Dividend Compass points since 2008.
Devil in the details
A glance at the results that feed into the Dividend Compass confirms these trends:
Recognizing these trends helps us focus our research. The negatives may or may not be as bad as they seem, but we do need to dig a little deeper to determine if the trends are genuine concerns.
On the slowing sales growth issue, JNJ has been adversely impacted by a few drug patent expirations, but relative to other major drug producers facing patent cliffs, JNJ's top-line isn't all that bad. JNJ's top-line has also been supported by consumer healthcare and medical device businesses. Still, the slowing growth is an issue to consider.
The declining earnings cover and ROE issues are linked as both metrics have been driven lower by the substantial litigation, product recall, and write-down expenses the company has taken over the past two years.
Excluding "one-time" charges like these, management expects 2012 adjusted EPS to be $5.05-$5.10 per share, which would equate to dividend cover near 2.1 times and implies an adjusted ROE of approximately 22-23%. In this light, things don't look quite as bad as the Dividend Compass score might suggest as the data is based on reported results and not adjusted results.
There's reason to believe that these expenses won't be recurring items, but the substantial charges have nevertheless impacted results as evidenced by slowing dividend growth and JNJ's relative under-performance over the period -- since the end of 2008, JNJ's share price has trailed the S&P 500 by 34 percentage points (SPY: +69.5%; JNJ: +35%).
However you view them, these one-time expenses matter and should be fully considered.
Bottom line
Whether or not you think there's cause for concern in this particular case, the Dividend Compass has helped us identify trends that required our attention. In some cases, we may find there's not a good explanation for the trends we see and that could be a sign to stay away or sell an existing position.
Hope you're having a great weekend and thanks for reading!
Best,
Todd
@toddwenning on Twitter
*This is not meant to be a full analysis of Johnson & Johnson nor is it an endorsement of the stock, but is meant to illustrate how the Dividend Compass can be used in your regular research. Further research is always necessary.
When it comes to equity analysis, a lot of attention is paid to valuation -- and rightly so, as your investing career will likely be a short one if you consistently overpay for assets.
Surprisingly, however, there's typically little attention paid to dividend analysis, which usually begins and ends with a glance at the dividend payout ratio (or dividend cover). As long as the company is earning more than it's paying out, the thinking goes, all is well with the dividend; conversely, if the company is paying out about the same amount as (or more than) it's earning, the dividend is at risk.
There's more to it
While the payout ratio is important, in my experience, the main causes of a dividend cut are factors other than a high dividend payout ratio (or low dividend cover). Indeed, a high payout ratio is usually the result of past events and trends that have been in place for a number of years.
In fact, more times than not, the need to strengthen the balance sheet is the cited reason for a dividend cut -- creditors and ratings agencies get worried about a lack of cash flow and large dividends become an easy target for freeing up cash. In turn, a weak balance sheet is often the result of a deterioration in business strength over a number of years -- margins have contracted, growth has slowed, and free cash flow has dried up -- paired with over-borrowing or over-spending.
Early diagnosis is the key
So rather than just look at the dividend payout ratio, it seems prudent to take a more holistic approach to dividend analysis by considering other factors that contribute to dividend health, such as:
Sales growth: Sales are the life-blood of a company. If sales are drying up, that puts added pressure on profits and cash flows and thus the dividend, too.
Interest coverage (EBIT/interest expense): If a company is having trouble paying the interest on its debt, there's a greater chance that its creditors will get worried and raise the company's cost of borrowing, which could reduce net income. In a worst-case scenario, the dividend could be cut to accelerate the repayment of principal.
Net debt/EBITDA: This is a common measure ((Debt-Cash)/EBITDA) that creditors and ratings agencies use to determine credit quality and it's commonly used as a metric in debt covenants. A firm that has borrowed too much or is struggling to pay down its debt relative to its profitability is more likely to have a risky dividend.
Dividend growth rate: A slowing dividend growth rate could be a sign that the company is less confident in its future growth potential. Eventually, all companies' dividend growth rates decline, but you want to see a steady decrease over many years and not a sharp drop.
Earnings cover: Even though I don't think it's the best measure of dividend health, earnings cover (Net Income/Dividends Paid) remains the most common metric cited by both companies and investors alike, so it should be considered in any dividend analysis.
Free cash flow cover: Free cash flow cover ((CFO-CapEx)/Dividends Paid) is a better measure of dividend health than earnings cover because companies don't pay out earnings -- they pay out cash. As such, I'd rather look at a company's cash flows than net income.
Operating margin: A company whose margins are contracting could be facing increased competitive pressures or becoming less efficient. When this occurs, less money falls to the bottom line and to cash flows and the dividend can become riskier. Cyclical companies' margins will naturally ebb and flow. In those cases, use rolling 5-year margins to account for the business cycle.
Return on equity: Companies that are unable to sustainably generate returns above their cost of equity are likely destroying shareholder value and usually have lower growth potential. Neither are good things from a dividend perspective.
Dividend Compass Tool
With this framework in mind, I tried my hand at a new (and hopefully improved) spreadsheet model for rating the health of a company's dividend. I'm calling it the Dividend Compass, and you can access and download it for free by clicking here.
(It's hosted on Google Docs for sharing purposes, but you can download it
to Excel by clicking on File>Download As>Excel on the top left
hand corner of the Google Docs page. Once you've downloaded it, you can make changes. If something doesn't work, please let me know in the comments section below.)
To get started, all you need to do is enter a few years' worth of key financial datapoints (sales, debt, etc.) -- all publicly available data -- on the Inputs tab and then click on the Dividend Compass tab.
The Dividend Compass (DC) will rate the company's dividend health based on metrics derived from your entries, with a 5 being a perfect score and 1 being the lowest. The overall score is based on the weighted average scores of the eight metrics and the default weights are based on what I believe to be the most important metrics. You can change them to fit your approach as long as they sum to 100%.
The DC will also grade the dividend going back a few years and provide a 5-year average score that will help you identify trends in the dividend's health. A falling score in any of the categoreis, for instance, may indicate a trouble spot that's worth looking into.
A few things to remember
I can't stress enough that the DC should not be used as a buy/sell indicator nor is it meant to be the final word on any stock. It's simply a research tool to help you tell the difference between a healthy dividend from a risky one, using a more holistic approach than traditional methods. Further research is always necessary before making a trading decision.
Dividend yield is not included as a graded metric in the DC. All else equal, I would expect higher yielding names to have lower scores and vice versa.
Finally, the DC is still in early days, so if you notice a bug or see room for improvement, please post a comment below. Questions and criticisms are always welcomed, too.
Hope you had a nice weekend.
Best,
Todd
@toddwenning on Twitter
(long JNJ, the default example in the DC spreadsheet)
Earlier this week, a friend recommended I take a look at this excellent post by Interactive Investor (UK) writer Richard Beddard that highlighted a recently launched dividend strategy from SocGen called the "SG Quality Income Index".
Assuming the backtest is accurate, the results of the SGQI index are intriguing:
Admittedly, I have been unable to find SG's original white paper on the Quality Income Index (if you have a copy, please let me know), but judging from the prospectus for a security linked to the QI index, here's the rundown:
The SG Global Quality Income Index (the Index) (Bloomberg: SGQINTR) is based on two basic principles. The first is that historically dividend yield represents the biggest component of equity returns and the second is that often equity investors are not rewarded for buying higher risk stocks. (my emphasis)
I've picked up from various othersites that the SGQI index also focuses on dividend sustainability and balance sheet strength while giving less value to traditional dividend cover metrics ("Our research suggests that good dividend cover is not a good indicator of how safe that dividend is in the future").
So is the SGQI the perfect methodology for approaching dividend investing? From what I've read thus far, I agree with some points and others I have remain skeptical about.
Where I Agree #1: Dividend paying stocks as a group tend to outperform
There's nothing revolutionary about SGQI's findings, as there are myriad studies supporting dividend-paying stocks (as a group) outperforming the market. Here are two practical reasons why I believe these studies have merit.
First, dividend payouts are "sticky" -- once they're started they're difficult to reduce or eliminate -- so management has to consider those regular cash outflows when making capital allocation decisions. A management team flush with cash is like the proverbial man with a hammer and they are prone to "empire building" through a rash of acquisitions. After all, it's in their best interest -- the bigger the company becomes the more they can demand from a pay perspective. Sadly, acquisitions (especially large ones) typically benefit the shareholders of the acquired company and not those of the acquirer. Having a regular dividend cash outflow, therefore, reduces the pile of cash at management's disposal and reduces the odds that management will invest in acquisitions that destroy shareholder value.
Second, a company that pays a regular and (ideally) an increasing dividend is more likely to be confident in the longer-term prospects for the company. By regularly increasing the dividend, management is indicating that it believes it will be able to afford that payout in the future. In addition, paying a regular dividend allows shareholders to immediately share in the company's success and realize cash flows alongside the company. Non-dividend paying companies, on the other hand, retain all cash flows to reinvest in the business and are thus implying that they can earn a higher rate of return on your cash than you could if they handed it back to you. There are some rare cases (think Apple under Steve Jobs) where that's reasonable and desirable, but it's not common for companies to be able to consistently reinvest all their cash at rates above their cost of capital. #2: Balance sheet health is important
Rapidly deteriorating balance sheet health was one of the major reasons that companies cut their dividends during the financial crisis. Indeed, 2007 set M&A records and a good number of companies overextended themselves with acquisitions thinking the good times would continue. When the financial crisis hit, these companies were often in danger of breaking their debt covenants, risked credit rating downgrades, or struggled to refinance near-maturity debt. As a result, dividend payouts were naturally cut in an effort to shore up cash and repair balance sheet strength.
To reduce the risk of balance sheet-induced dividend cuts, I look at a company's interest coverage (EBIT/interest expense) track record and want to see at least 3x cover on a consistent basis. Another good rule-of-thumb is to avoid companies with net debt-to-EBITDA ratios above 2x. Unless that company has sustainable competitive advantages and stable margins, an economic downturn could quickly call its dividend into question.
#3: Underlying business economics matter
SG stresses that quality income payers must have both a robust balance sheet and robust underlying business economics. Indeed, it is critical to have both.
A firm with a solid balance sheet, but deteriorating business fundamentals won't likely make for a great investment. Eastman Kodak, for instance, had a pretty solid balance sheet in the late 1990s, but its business economics were beginning to deteriorate as digital photography stole share from Kodak film. That's why it's critical to frequently assess the strength of a company's competitve position -- are there new substitute products, new or strengthening competitors, a loss of an imporant patent, etc. that could impair the company's ability to generate strong returns?
If the company's competitive position is deteriorating, it's probably best to pass on it as an investment even if it's currently in good financial health.
#4: Don't chase yield
As I've said before, ultra-high dividend yields can mean ultra-high risk of a dividend cut. The market doesn't often give away low-risk 8%-plus yields, so it pays to be skeptical of any yield that seems too good to be true. I really liked this chart that SG put together that compares realized and forecast dividend yields and provides statistical support to the notion that the higher the initial yield, the more likely that yield is unsustainable.
#5: Boring stocks are often undervalued
In The Future for Investors, Wharton professor Jeremy Siegel revealed the best performing U.S. stocks between 1957 and 2003. The best performing stock was tobacco giant Philip Morris (now Altria), which generated an incredible 19.75% annualized return over that period. Other top-performers on the list included Coca-Cola, Pfizer, Heinz, Unilever, and Wrigley. These companies may not have operated high-octane businesses, but they earned steady profits and had sustainable competitive advantages that helped them maintain pricing power over many decades. This translated into incredible returns for their long-term shareholders.
Indeed, in Peter Lynch's classic One Up on Wall Street, he lists thirteen signs of an attactive stock. Among them are several recommendations to look for "boring" stocks, including: It sounds dull - or, even better, ridiculous; It does something dull; It does something disagreeable; There's something depressing about it; and It's a no-growth industry.
Boring, high-quality stocks are attractive long-term investments precisely because they aren't going to grab a lot of investor attention and are thus more likely to be undervalued. Who wants to brag to their friends that they picked up 1,000 shares of a company that makes cleaning products? It's much more fun to talk about the stocks du jour -- the Facebooks of the world. Financial headlines love a good high-growth story and you won't see the FT flashing a story about a company that's raised its dividend for 10 years in a row, but the latter are exactly the types of companies you should look to own as they have been creating real long-term shareholder value.
Reasons to be skeptical #1: Always be wary of backtests
The SGQI backtest reminded me of the backtests done by WisdomTree when it was launching its line of dividend-weighted ETFs. As I wrote in 2009, WisdomTree's dividend-weighted model supposedly would have worked great in the past, but struggled to produce the same results when the dividend landscape dramatically changed during the financial crisis amid the hundreds of dividend cuts between 2008 and 2009.
Judging from the performance chart (the first one on this page), SG studied the period 1989-2011. 22 years is a decent amount of time, but the data population is relatively small (8,030 days) and subject to more error.
SG's backtest also assumes no transaction costs or commissions -- both of these things (as well as taxes) are critical components to realized returns and can't be overlooked.
Backtesting is a fine way to test a strategy or theory -- so I'm not critical of SG using a backtest -- but it's important to take backtests with a grain of salt as they are backward looking and investing is a forward-looking activity. Specialized or formula-based strategies that worked in the past may not work in the future.
#2: Pre-buybacks
A lot has changed in the dividend world since 1970. At the time, stock buybacks were essentially non-existent and cash dividends were the primary way of returning shareholder cash. Today, a lot of companies prefer buybacks to dividends for a number of reasons -- they aren't as sticky as dividends, they can artificially increase EPS, and can increase financial leverage.
Even though I prefer dividends to buybacks (a subject for another post), there's no doubt that buybacks are now a force to be reckoned with and thus should be considered in any dividend-focused backtest:
Source: Aswath Damodaran
#3: Dividend yield as the biggest component of equity returns
Recall that expected return is approximately equal to starting dividend yield + dividend growth +/- P/E re-rating.
SG argues that dividend yield was the biggest component of equity returns between 1970 and 2011. That might be true and I don't have all the data they used to compile their chart (the second chart from the top), but using some annual data for the S&P 500 between 1960 and 2011, I put their findings to the test.
I took the starting dividend yields each year between 1960 and 2001 and measured the rolling 10-year annualized changes in dividend growth and P/E over the subsequent 10-year period.
Data Source: Aswath Damodaran
My (less scientific...hopefully) findings were a little different from SG's. The median dividend yield over this period was 3.4%, the rolling 10 year median dividend growth was 5.4%, and P/E contribution was 0.5%. My data seems to suggest that it's, in fact, dividend growth and not dividend yield that has been the primary driver of long-term equity returns. At least in the U.S.
Moreover, average dividend yields were much higher in 1970 than today -- 3.46% in 1970 vs. 2.07% in 2011 -- so SG's results might be a function of the chosen starting year. Thanks to the widespread use of buybacks as an alternative to dividends, I don't think we'll get back to consistent 3%-plus average dividend yields in the U.S., so I doubt that dividend yield will be the largest component of equity returns over the next 40 years.
#4: Dividend cover less important
I do agree with SG that balance sheet health needs to be considered when evaluating the quality of a dividend-paying stock, but I would be interested to see the data behind their claim that dividend cover was not a good indicator of dividend sustainability. Intuitively it doesn't make sense. A company thatconsistentlycovers each dollar of dividend with $3 in free cash and earnings will likely pay a more sustainable dividend than one that covers each dollar with $1.20 in free cash and earnings.
If they were using annual dividend cover data rather than normalized dividend cover data (a five year average), I can see why dividend cover metrics may be less explanatory. That's because in any given year highly cyclical companies may have great coverage metrics if the economy is strong, but the coverage can quickly deteriorate in a recessionary year.
When you're measuring a company's dividend health, I recommend using at least five years of data (preferably more, if available) to see how dividend cover has changed over the years. For cyclical companies, use normalized figures to avoid the trap of misleading fundamentals in peak years. #5: Lots of money flowing to dividends
I wasn't at all surprised to hear that SG was launching an ETN that tracks the QI index.Fact is, with bond rates so low right now there's a ton of money flowing into dividend-focused ETFs and funds, and just like any industry that's receiving a lot of capital it naturally inspires innovation in the space. Looking back, some of those innovations will be helpful to investors while others won't. Therefore, it's important for investors to be skeptical of any new mouse-trap aimed at dividend investing today.
#6 Dividend paying stocks are not like bonds
In SG's advert for the QI ETN, they state: "quality income stocks can provide the bond-like characteristics of income and capital safety, but also offer scope for capital growth like equities." If that sounds too good to be true, that's because it is.
With a stock (no matter how high quality it might be), your principal and dividends are at total risk, whereas with bonds there's a contractual obligation for the company to pay you back interest and principal on certain dates. What SG is actually describing in that sentence are convertible bonds that allow you to convert your bond into equity at a predetermined price if the stock price rises, but also offers downside protection in that you can simply hold the bond to maturity if the stock declines.
While I think that income-minded investors with a long time horizon should consider a diversified dividend-portfolio in this low bond-rate environment (in the context of their individual risk tolerance, investment objectives, etc.), it needs to be made clear that bonds and stocks have very different risk profiles.
Bottom line
I applaud SG for adding additional insight and research into the field of dividend investing, but I won't be purchasing the QI ETN.
(Note: I had some publishing problems with this post. If you notice any minor changes, it's because I had to rewrite some sections.)
--
The first rule of dividend investing (or at least it should be the first rule) is: If the yield is too good to be true, it probably is.
In an article I wrote last May, I looked into the highest-yielding stocks on the UK FTSE All-Share and found that four names had trailing dividend yields more than twice the FTSE A/S then-average of 3.3%: Cable & Wireless Communications (14.1% yield), Man Group (11.1%), Cable & Wireless Worldwide (8.87%) and Thomas Cook (6.92%).
These ultra-high yields were either implying the market's anticipation of a dividend cut or that the market was missing something really important about the company's prospects. The market is actually a really good predictor of forthcoming dividend cuts (the share price falls and drives the yield upward to unrealistic levels), so I cautioned dividend investors to stay away from those four ultra-high yielders unless they had a really compelling reason to think the market was wrong.
Since that article was published, Man Group, C&W Worldwide and Thomas Cook have each announced changes to their dividend policy, and just this week insiders at Cable & Wireless Communications said the company was considering a dividend cut in the coming year.
By no means am I taking a victory lap -- I never like to see a dividend cut since someone somewhere is depending on it to supplement their income -- but I wanted to reinforce the principle that an ultra-high dividend yield usually means the dividend is at risk.
This is particularly true in a bull market -- if the company was performing well, the market should bid up the share price and drive down the yield closer to the market average. When that doesn't happen, it's time to get suspicious.
Know when to walk away
If you're unsure if a yield is too high, try comparing it to the market average yield. In the U.S., my rule-of-thumb is to be wary of any yield 2.5x or higher than the S&P 500 average; in the U.K., any stock yielding more than 2x the FTSE All-Share average should be approached with caution. For example, the current average S&P 500 yield is 2%, so any U.S. stock yielding more than 5% today should raise the yellow flag.
Rather than rely too much on heuristics, though, let's dig a little deeper into why ultra-high yields are dangerous...
The equation for expected long-term returns from equities is = starting dividend yield + dividend growth rate +/- change in P/E (sometimes called re-rating).
So if you buy a stock with an initial yield of 3%, expect the payout to grow at 7% annualized, and expect no change in the P/E, you can reasonably estimate that your long-term return from the investment will be 10%.
To show how this relationship holds up, consider the return components of the S&P 500 between 1996 and 2011:
Keeping in mind the expected return equation of "dividend yield + dividend growth +/- PE change", if the current market is yielding 3% and average long-term market dividend growth rate is 5% (the S&P 500 annualized growth rate from 1960-2011) -- and assuming no re-rating -- the market's expected long-term return is 8%.
If the stock you're researching in that same market has a yield of 14%, then, you need to be able to answer the variables for dividend growth and re-rating and why your expected return should be 600 basis points above the expected market return.
There's probably a good reason for the discrepancy that can be explained through further research into the business. The odds are pretty strong that such a wide discrepancy will revert to the market average somehow -- and it's likely to come from a negative dividend growth rate. A meaningful decrease in the P/E ratio is unlikely because a stock trading with a 14% yield probably trades with a single-digit P/E to start with. So again, we're left with a negative outlook on the dividend growth rate.
On the other hand, if you come across a stock yielding 5% in a 3% market, that's not quite as worrisome. It's possible, for example, that the long-term dividend growth rate will be 5% and -- assuming no re-rating -- the expected long term return will be 10%. It's much easier to find a stock that might be slightly underestimated by the market (in this case 100 basis points) than one that's being underestimated by 600 basis points.
Bottom line
It's natural for income-minded investors to get interested in high-yielding stocks, but it's important not to get greedy. The investor's thinking is normally something like "Well, if the company can even maintain that 8% or 10% payout for a few years, it'll be a nice win for me." The market, however, rarely gives away such easy returns and that 8% or 10% yield is probably telling you that the market doesn't think the dividend is sustainable.
All this is to say...never forget rule #1 of dividend investing -- if a yield is too high to be true, it probably is.
Essential weekend reading:
Jeremy Grantham's Q1 Letter (GMO Capital) -- excellent as always