Showing posts with label high yield. Show all posts

Friday, September 5, 2014

An Important Dividend Cut Case Study

Back in March, I explained why I sold my position in Tesco for a 22% loss.

Looks like it was the right move. As of this writing, the stock is down another 25% from my selling price. Worse, the company recently reduced its interim dividend by 75%.

Double whammy

By no means was I the first to highlight trouble at Tesco and plenty of observers have offered reasons for the company's decline. My focus here will be on the dividend.

Frankly, I'm still a bit stunned at how Tesco's turned out and think its dividend cut serves an important case study for dividend investors to review.

Consider that in fiscal year 2011 (year-end February 2011) Tesco increased its dividend by 10.8% -- marking an impressive 27 consecutive years of dividend increases. Well-respected long-term investors like Neil Woodford and Warren Buffett held considerable positions in Tesco and its UK market share was over 30%. All seemed to be right.

The board and management also appear to have been very confident in the future of the business, otherwise they wouldn't have increased the dividend at such a high rate in fiscal 2011.

With the exception of a financial crisis-scenario, rarely does a company have such a sharp reversal in dividend policy. Yet that's exactly what happened at Tesco. 

In fiscal year 2012, the dividend grew just 2.1%. The next year, it was held flat and stayed at that rate until it was finally cut in August 2014.

Source: Company filings
The company's dividend health, as measured by the Dividend Compass, was also deteriorating.


While some warning signs were present, the combination of Tesco's distinguished dividend track record, its real estate holdings, and its leading share of the UK grocery market remained for some compelling reasons to hold and hope for a dividend turnaround.

Yet the numbers didn't lie. Tesco's dividend health slowly worsened, the dividend yield steadily increased to more than twice the UK market average (usually a good sign that something's wrong), and it was only a matter of time before the board needed to make some tough decisions. 

Lessons learned

The first takeaway from Tesco's dividend cut is a reminder that no dividend is risk-less or sacrosanct. In the UK market, Tesco was a core holding in many dividend portfolios (including mine for a while) and up until a few years ago its payout was about as much of a sure thing as one could expect. Yet in a matter of three years Tesco went from dividend aristocrat to dividend plebian. If worse comes to worse, the board can always cut the company's dividend.

Second, it's critical to not "buy and forget" your investments. I know some well-intentioned dividend strategies advocate this approach and while I certainly appreciate the value of patience and keeping trading costs to a minimum, what happened with Tesco serves as an example of why some level of maintenance research is needed if you hope to avoid dividend cuts.

The combination of a permanent capital loss and a dividend cut can have a material impact on your longer-term income returns and you'll have less capital to reinvest in another dividend-paying stock. If you can catch a dividend cut early, you have much higher odds of preserving more of your capital.

Third, no matter how strong the company's dividend track record, if the numbers don't add up, it pays to be skeptical. Admittedly, I held onto Tesco a little too long thinking that it would simply take some time for the company to right the ship. When in doubt, preserve capital.

Fourth, while most dividend-focused portfolios are diversified, the Tesco share price decline and dividend cut is a reminder that it's important not to rely on any one stock (or one sector) to generate a large percentage of your dividend income.  

Finally, even if you're a patient investor, it's important to establish some selling rules. For example, one rule might be that if a company's dividend growth trajectory radically changes for the worse or is altogether halted, it's time to sell. In such a situation, it's highly likely that company leaders have changed their opinion about the company's ability to generate higher levels of cash flow.

What do you think? Let me know on Twitter @toddwenning

What I've been reading this week
Stay patient, stay focused.

Best,

Todd


Thursday, June 12, 2014

The Danger of Having an Absolute Dividend Yield Target

I think it is possible to deliver a 4 per cent yield and to deliver dividend growth, going forward, but as I say, you must never allow an income target to dictate what you own. - Neil Woodford (UK fund manager)

In this low interest rate era, the demand for current income remains strong -- particularly among those living on a fixed income.

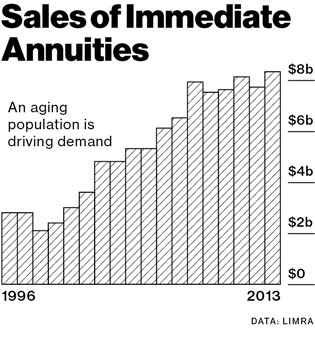
Indeed, sales of immediate annuities recently hit a record, even though the buyers are effectively locking in low rates for the life of the contract.

Due to this demand, a common question you’ll read on various dividend-focused message boards is some variant of:

“I need to construct a dividend portfolio that yields (some unreasonable %). What stocks should I buy to achieve this?”

At first glance, it might seem a reasonable approach -- simply buy a few stocks with yields that meet your target yield, and then sit back and watch the cash flow in.

Putting the cart before the horse

As Woodford noted in the aforementioned quote, however, it’s never a good idea to start with an income target - especially a high one - and work backward as it can open up a number of longer-term risks.

To see why, let's say you wanted to build a portfolio with a current yield of 6% today...

1. Increased sector concentration: To achieve such a high yield right now, you'd need to anchor the portfolio in investments like royalty trusts, energy MLPs, and REITs -- and speculative ones at that. The market’s higher-yielding stocks are typically clustered in a few slower-growth (e.g. utilities), troubled, or speculative sectors. For example, such a strategy would have put you into a lot of bank stocks pre-financial crisis. If one thing goes wrong in the sector, your portfolio could be wiped out.

2. Increased risk: At present, the average yield on the S&P 500 is about 2%. When a stock is yielding more than 2x this average - particularly in a period of strong demand for dividend stocks - the market isn't likely pricing in much growth. For ultra-high yields, the market might even price in a dividend cut.


3. Skews your selection process: When you've set an absolute dividend yield target that's far above the market average, you're no longer focused on doing thorough research and building a portfolio of good (and well-bought) companies that can sustain and raise their payouts over time. Instead, your sole focus is on dividend yield and the other important factors are rationalized away.

What to do instead

A better alternative to setting a high and absolute yield target is to set up a relative one like, "at least 25% above the market average." In addition, establish a target dividend growth rate such as, "grow annual income more than 3 percentage points above inflation."

That way you aren't fighting the market while getting above average income, you'll find more quality companies to consider, and you can maintain a longer-term focus (i.e. balancing current and future income).

Stay patient, stay focused.

Best,

Todd
@toddwenning on Twitter


Saturday, April 5, 2014

4 Things to Know About Dividend Investing

Earlier this week, Fidelity posted an interesting article on Morningstar.com that discussed the importance of considering dividends from both a historical and forward-looking perspective.

Here are my four key takeaways from the article:

1. Screen for companies with high yields and low leverage

While equity-related metrics like FCF cover are absolutely critical in dividend analysis, we simply cannot afford to overlook a company’s balance sheet and its ability to repay its creditors.


After all, a company can’t consistently direct undue amounts of cash flow toward common shareholders at the expense of creditors; otherwise, the firm risks a credit downgrade and higher borrowing costs, which, all else equal, will eventually trickle down to the bottom line. Specifically, firms with particularly high dividend yields could be under pressure from creditors to redirect more cash flow toward repaying debt.


As such, you want to look for companies that strike a healthy balance between satisfying creditors and rewarding shareholders, as they’ll be more able to obtain favorable borrowing terms without harming their ability to pay dividends. This is one reason why why the Dividend Compass spreadsheet places a 25% weighting on leverage and interest coverage ratios.


One strategy is to look for firms with investment grade credit ratings, being particularly careful with high dividend yield firms with credit ratings right on the border between investment-grade and junk ratings (BBB- or Baa3) as they may be more prone to cut the dividend to preserve their investment-grade credit rating.

Even if a firm has a published credit rating, you don’t want to blindly take the rating agencies’ word for it. Consider the company’s debt/equity, net debt/equity, and interest coverage ratios and compare them to their peer and market averages.


2. Ultra-high yield = ultra-high risk

In the movie Elf, Santa gives Buddy some advice before he heads to New York City: “You see gum on the street, leave it there. It isn’t free candy.”

The same could be said for stocks with ultra-high dividend yields. There’s always a catch. Rarely will a stock’s dividend yield approach the top quintile due to dividend growth. Rather, high yields are almost always due to a depressed share price. Because of this, it shouldn’t be surprising that dividend cuts typically come from the top yield quintile.


3. The market is good at sniffing out dividend cuts well ahead of time


If someone can point me to a case where a company cut its dividend after its stock outperformed the market over the trailing twelve months, I’d love to learn about it because I can’t recall coming across such a scenario.


Unsurprisingly, Fidelity found in its research that a dividend cut typically follows a period of extended market underperformance.


While the market may not discount the stock price specifically because of diminishing dividend health, a declining price (particularly relative to the market) is usually indicative of an intensified competitive landscape or at least a departure from “business as usual” for the company. 

What typically follows are contracting margins, greater uncertainty around net profits and free cash flow, and mounting pressure from creditors and the ratings agencies. None of this supports dividend health.

This is why it’s so important to a) own firms with durable competitive advantages (i.e. economic moats) and b) keep tabs on how the firms’ competitive advantages are strengthening and weakening with time.


4. The importance of estimating dividend growth

Getting future dividend growth correct is more than half the battle; however, is easier said than done.

Still, it’s important to go through the process of determining a company’s dividend growth potential. At the very least it could save you from investing in a firm with deteriorating dividend health.

How can we go about doing this?

You can use historical data and trends as part of your forecast (this is what the Dividend Compass does), but we don’t want to make decisions solely on what’s happened in the rear-view mirror.

As Fidelity suggests, the best bet is to use a combination of historical perspective and forward-looking analysis.

Now, one school of dividend investing says, “Why bother making forecasts? It’s not like you know what’s going to happen.”

Fair enough, but any time you buy a stock you are already making an implicit forecast as the market’s outlook is baked into the current share price. Might as well make some explicit forecasts, I reckon, and hold yourself accountable for them.

If you’re really interested in learning how to make detailed forecasts, NYU professor Aswath Damodaran explains it much better than I can both here and in his books.

Good reads this week
  • Why employers should encourage reading at work. - Shane Parrish
  • When faced with big decisions, baseball umpires tend to play it safe. - Quartz
  • Transcripts of Buffett speaking with Notre Dame business students in 1991 - Whitney Tilson
  • Why moats matter in dividend investing - Total Return Investor
  • There's no substitute for good judgement - Above the Market
  • Why you don't need to worry about HFT - Monevator 
Quote of the week
If the Chairman of the Federal Reserve called me tonight and said “I am really panicking and things are terrible,” I don’t care. We will do exactly what we were going to do tomorrow morning. The truth is, on balance, we will do more business when people are pessimistic. - Warren Buffett
Stay patient, stay focused.

Best,

Todd


Saturday, October 19, 2013

An Easy Mistake Made by Dividend Investors

Dividend investing can seem deceptively easy. If you want to generate, say, a 5% yield from your dividend portfolio, you only need to buy a group of stocks that provide a weighted average yield of 5%. Then just sit back and watch the money roll in.

Or so the thinking goes.

And, yes, you may indeed receive your desired dividend income if you follow this strategy, but constructing a portfolio in this manner without attention to valuation could end up costing you in the longer-term.

Consider two investors that each invested $100,000 in dividend portfolios with 5% starting yields. Over the course of ten years each investor realizes annual dividend growth of 3%. The first investor (blue line) bought stocks that were considerably overvalued and subsequently lost 20% in capital value in year one; alternatively, the other (red line) invested in stocks that were undervalued and gained 20% in capital value in year one.

After the year one corrections to fair value, both portfolios grow at 8% per year through year 10.


At the end of ten years, both portfolios generated the same amount of dividend income ($57,319), but their ending capital values are nearly $80,000 apart ($159,920 vs. $239,880). It's hard to imagine that the two investors would feel equally good about their performance even though they realized equal dividend income over the ten year period.

To further my point, if both investors decided to liquidate their dividend portfolios in year 10 and invested their capital in bonds with 5% coupons, the first investor would receive annual payments of $7,996 while the second investor would receive $11,994 per year until maturity.

This is an admittedly simple example, but it illustrates an important point about the hidden costs of not paying attention to valuation in income investing. Ultimately, capital growth matters.

Valuation avoidance (Photobucket)
Whether you use relative valuation methods (i.e. comparing P/E ratios, etc.) or absolute valuation methods (i.e. dividend discount models, discounted cash flow models, etc.), the important thing is to fully consider the price you're paying and the value you're getting from each investment. Get to know the businesses you'd like to invest in, understand what drives their performance, and don't rely on a single metric -- in this case, dividend yield -- to guide your buying decisions.

Good dividend investing eschews complexity, but that doesn't mean it's supposed to be easy.

Good reads this week

Quote of the week
A mildly non-conventional investment approach, emphasizing a business approach to security selection, gives some opportunity for long-term results slightly above average without corresponding increase in investment risk. - Warren Buffett
If you think this article may be of interest to a friend or colleague, feel free to forward it, and let me know if you have any questions about topics discussed. 

Best,

Todd 
@toddwenning

Saturday, February 23, 2013

Valuing Dividend Paying Stocks

Despite the increased interest in dividends these days, you don't hear much about dividend-based valuation methods.

While the more popular discounted cash flow valuation methods are instructive in their own ways, dividend-based valuation models are also worthy of consideration.

For one, dividend-based models measure actual cash outflows to the investor rather than potential cash outflows (free cash flow). In addition, they assume the perspective of the minority investor (you and me) instead of a controlling shareholder. Finally, dividend payouts tend to be less volatile than free cash flow on a year-to-year basis.

Like any valuation method, dividend-based models do have their drawbacks, the most obvious being the challenge of valuing non-dividend paying companies. Further, in order for a dividend model to be appropriate, there must be a clear relationship between the company's underlying profitability and dividend payout. The model is best applied to companies with a target dividend payout ratio (or cover), that pay out a significant percentage of earnings as dividends, and that have a track record of increasing their dividends alongside higher profits.

Putting it into practice 

Today, we'll use the dividend-based "H-Model" to value Coca-Cola. Before we start, I must stress that this exercise is for illustrative purposes only and not a recommendation to buy or sell Coca-Cola.

The H-Model formula may seem intimidating at first, but I think it will begin to make sense fairly quickly:


Value = (DPS * (1+gL)) + (DPS * H * (gS - gL))

        (r - gL)                      (r - gL)

Where:

DPS = dividends per share (trailing twelve months)
r = Cost of equity (10% is a good baseline for large cap, average uncertainty companies)
H = half-life of exceptional growth (i.e. if you expect 20 years of high growth, H = 10)
gL = Stable growth rate (shouldn't exceed 2-3%)
gS = Initial high growth rate


The first half of the equation represents the company's intrinsic value assuming stable growth going forward, while the second half of the equation captures the value of the company's extraordinary growth potential.

The H-Model assumes a linear decline in the company's dividend growth rate over time until it reaches a stable growth rate (the growth rate of the larger economy).


Let's jump right into it by plugging numbers and assumptions into the H-Model. We know for a fact that the trailing-twelve month dividend per share figure is $1.02. That's the one indisputable fact in the formula and the rest are the assumptions.

(The fact there are so many assumptions required in absolute valuation models may turn some investors off from them, but anytime you purchase a stock you're already making implicit assumptions about the company's future -- i.e. the assumptions baked into the market price. Might as well spell them out, in my opinion, and learn more about the company in the process. But I digress.)
  • For years of extraordinary growth, it's important to consider the strength of the company's competitive advantages. Few companies will be able to grow their dividend payouts at a pace significantly higher than the economy's growth rate for thirty years, but Coca-Cola's brands and efficient distribution network are exceptional. Thirty years of above-stable growth may still be aggressive, but we can account for different scenarios later on. Most companies will fall into the 10-20 year range, again depending on the strength of their competitive advantages.
  • For cost of equity, 10% is a good starting point for large companies with average uncertainty. A smaller company, or a large company with higher uncertainty, may require a cost of equity of 12% or more. Again, we can account for different costs of equity in a scenario analysis.
  • The stable growth rate is the long-term growth expectation for the larger economy. In developed markets like the U.S., this shouldn't be more than 3%; 2% is a more conservative estimate. The reason the stable growth rate needs to approximate the long-term growth rate of the economy is that by assuming a higher growth rate than the economy, we're implying that eventually this company will become the economy. That's unlikely, unless we're talking about Google. :)
  • Finally, for the initial high growth rate, you can base it on the average annual dividend increase over the past three or five years, the sustainable growth rate (discussed here), or the most recent dividend increase as long as it isn't too out of the ordinary. For Coca-Cola, we'll use the most recent dividend increase of 10% as a starting point.


The equation looks like:

Value = ($1.02 * (1 + 2%)) + ($1.02 * (30/2) * (10% - 2%))
                    (10% - 2%)                           (10% - 2%)

Value = $28.31

With this fair value estimate in hand, we can compare it to the current market price to determine if today is a fair buying opportunity. As of February 22, Coca-Cola shares traded for $38.52 --136% of our fair value estimate. At first glance, then, Coca-Cola does not seem to be an attractive buy today.

Based on Coca-Cola's 2012 EPS of $1.97, this result would imply a P/E of 14.8 times. This is significantly lower than the company's five-year average P/E of about 18 times.

Missing something?

As we know, buybacks have become an increasingly important way for companies to return shareholder cash. Even though we might prefer dividends to buybacks, it's nevertheless instructive to consider buybacks as part of the total payout per share, as buybacks can be considered part of a company's cash return to shareholders.

Because a company's buyback activity tends to ebb and flow over time, determining a reliable "buybacks per share" figure can be tricky. If you simply take buybacks in a given year and divide by shares outstanding, for instance, the baseline figure could be too high or too low.

Instead, I recommend taking a five-year average of total buybacks (found in the cash flow statement), add it to the most recent year (or trailing-twelve month) dividend payout, and divide that sum by shares outstanding to arrive at a "total payout per share."*


Since we are assuming a total payout per share figure that accounts for both dividend and buyback growth, we also must reduce our initial growth assumptions for the model. The reason for this is we're accounting for the company paying out a larger percentage of earnings to shareholders, leaving less to reinvest in the business. Holding return on equity steady, this would result in a lower growth rate.

For this example, we'll dial back our initial growth from 10% to 7%.


This result implies a P/E of 18.4 times, much closer to Coca-Cola's five year average.

For Coca-Cola, at least, it seems more consistent to include buybacks in the model since 42% of its distributions to shareholders came in the form of buybacks over the last five years. If we're just counting dividends, we might be excluding a meaningful amount of value in our estimate.

As long as the company hasn't consistently overpaid for its own stock or borrowed heavily to fund the buybacks, I have no problem including buybacks in the total payout equation.

Scenario testing

Regardless of which valuation approach you use (relative valuation, DCF, DDM, etc.), it's imperative to consider different scenarios, since your baseline assumptions will not likely come to pass.

Given the simplicity of the H-Model, we can quickly enter alternative inputs to establish a range of values:


In this example, I've kept the stable growth and cost of equity constant and tested the years of extraordinary growth and initial high growth rate variables, but you can certainly test the other variables, as well.

Get started, but be careful

Any time I write about valuation, I feel a bit like the mother from A Christmas Story after Ralphie gets his Red Ryder B.B. gun -- "Don't shoot your eye out!" A model that's inappropriately used can have negative consequences, so be sure to enter accurate historical data and use reasonable forecasts.

That said, give the H-Model a try on some of the companies on your watchlist and let me know how it works out for you.

Best,

Todd
@toddwenning on Twitter

*Hat tip to Aswath Damodaran for this method

Saturday, January 26, 2013

The Most Dangerous Time to Pick High-Yield Stocks

The most dangerous time to pick high-yield stocks is in the late stage of a bull market, which I believe we're in today.

One of the oldest investment adages is that "bull markets climb a wall of worry" and that has certainly been true of this market. Despite all the various crises -- Greece, the Eurozone, fiscal cliffs, debt ceilings, Manti Te'o's girlfriend, etc. -- many major global markets are at or near five-year highs. 


From a dividend investor's perspective, however, it's precisely the worry that provides the opportunities to buy quality high-yield shares -- defined loosely here as companies with strong balance sheets, plenty of dividend cover, a good track record of raising dividend payouts, and sustainable competitive advantages -- at discounted prices.


As markets rally and the worry dissipates, however, dividend yields naturally go in the opposite direction and the number of good opportunities dries up.


Quality rallies early

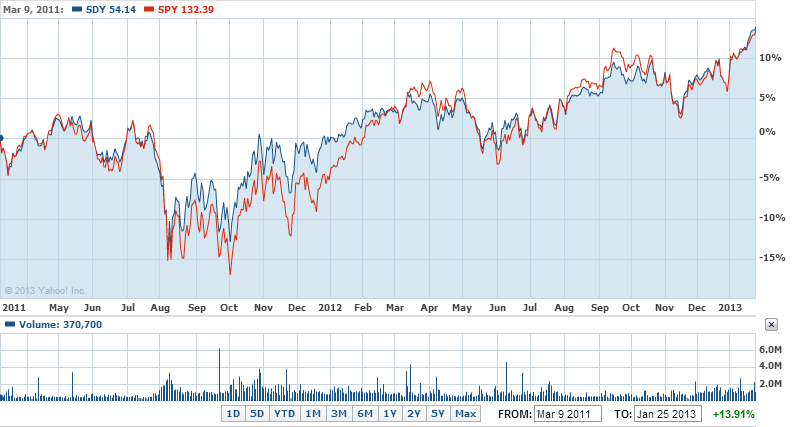
Consider the performance of the SPDR S&P Dividend ETF (SDY) -- which tracks the S&P High Yield Dividend Aristocrats Index -- versus the SPDR S&P (SPY) since the nadir of the financial crisis.


Source: Yahoo! Finance
Just about neck-and-neck over the period, but let's take a look at how they performed in the two years after the low-point in the market:

Source: Yahoo! Finance
For most of this two year period, the SDY steadily outperformed the index. Eventually, however, the index caught up and they've been trading pretty much in-line ever since:

Source: Yahoo! Finance
Though the S&P High Yield Dividend Aristocrats Index may not be the perfect tracker of "quality" dividend stocks, I do consider it a fair proxy. As such, we can gather from this example that quality dividend payers got snapped up fairly quickly in this bull market. By early 2011, the Aristocrats index was likely trading at or near fair value.

Once the quality names have been picked up in the early stages of a bull market, investors looking for a combination of high-yield and quality are normally left needing to compromise one for the other.

This isn't to say there aren't special cases for investors to pick up quality high-yield names at a discount during a bull market -- markets can also overreact to a bad earnings report or temporary sector concerns -- but, as a whole, quality high-yield names are normally snapped up early on.

Scraping the bottom of the barrel

When examining a high-yield stock in this type of market, it's imperative to examine why the stock's yield remains well above the market average. If it possesses market-average risk and growth potential, it stands to reason that its yield should also approximate the market average and that investors should have bid up the stock price by now. If its current yield is still 2x the market average, then, it's probably a good indication that something is wrong with the underlying business -- either it has considerable risk factors or its growth outlook is quite meager. In either case, it probably can't be defined as a "quality" dividend payer.

To further illustrate this concept, let's step into the way-back machine for a moment and travel back to early 2008, near the end of the previous bull market. At the end of 2007, the S&P 500 average dividend yield was 1.89% putting any stock over 3.8% firmly into the high-yield category (my rule-of-thumb is 2x the market average in the U.S.).

I was able to find a helpful table of the highest-yielding Dow 30 stocks as of January 24, 2008 and examine their subsequent five-year dividend growth rates.

Source: CNBC.com, Yahoo! Finance; Altria dividend growth as of June 2008, post-PM spin off.
The dividend-based performance of these shares since the end of the last bull market is certainly mixed, with Altria being the stand-out star, especially when you factor in the performance of Philip Morris International over the period. AT&T and Verizon did reasonably well, too, but you certainly got what you paid for -- high-yield and low dividend growth. As for Pfizer, Citigroup, and GM...the numbers speak for themselves. 

A look at the highest-yielding stocks in the S&P 500 from around the same time is even more troubling, with a number of famous dividend blow-ups found therein. 

Granted, a good percentage of the 1,000+ dividend cuts by U.S. companies in 2008 and 2009 were financials and I don't expect another massive round of dividend cuts in the near future, but the principle holds true that investors should be very skeptical of the highest-yielding stocks in the late stages of a bull market as the "margin of safety" has shrunk considerably.

A cautionary tale

If you've already built your dividend-focused portfolio, this may be a good time to review the highest-yielding names in your portfolio, but it isn't necessarily a screaming sell signal if you have a long time horizon and can afford to be patient. On the other hand, if you're starting to build a dividend-focused portfolio right now or are looking to add new names to your portfolio, proceed with caution when considering high-yield stocks.

As always, thanks for reading and please post any comments below or on our dividend investing community page on Google Plus.

Best,

Todd
@toddwenning on Twitter


Saturday, April 21, 2012

Ultra High Yield = Ultra High Risk

The first rule of dividend investing (or at least it should be the first rule) is: If the yield is too good to be true, it probably is.

In an article I wrote last May, I looked into the highest-yielding stocks on the UK FTSE All-Share and found that four names had trailing dividend yields more than twice the FTSE A/S then-average of 3.3%: Cable & Wireless Communications (14.1% yield), Man Group (11.1%), Cable & Wireless Worldwide (8.87%) and Thomas Cook (6.92%).

These ultra-high yields were either implying the market's anticipation of a dividend cut or that the market was missing something really important about the company's prospects. The market is actually a really good predictor of forthcoming dividend cuts (the share price falls and drives the yield upward to unrealistic levels), so I cautioned dividend investors to stay away from those four ultra-high yielders unless they had a really compelling reason to think the market was wrong.

Since that article was published, Man Group, C&W Worldwide and Thomas Cook have each announced changes to their dividend policy, and just this week insiders at Cable & Wireless Communications said the company was considering a dividend cut in the coming year.

By no means am I taking a victory lap -- I never like to see a dividend cut since someone somewhere is depending on it to supplement their income -- but I wanted to reinforce the principle that an ultra-high dividend yield usually means the dividend is at risk.

This is particularly true in a bull market -- if the company was performing well, the market should bid up the share price and drive down the yield closer to the market average. When that doesn't happen, it's time to get suspicious.

Know when to walk away

If you're unsure if a yield is too high, try comparing it to the market average yield. In the U.S., my rule-of-thumb is to be wary of any yield 2.5x or higher than the S&P 500 average; in the U.K., any stock yielding more than 2x the FTSE All-Share average should be approached with caution. For example, the current average S&P 500 yield is 2%, so any U.S. stock yielding more than 5% today should raise the yellow flag.

Rather than rely too much on heuristics, though, let's dig a little deeper into why ultra-high yields are dangerous...

The equation for expected long-term returns from equities is = starting dividend yield + dividend growth rate +/- change in P/E (sometimes called re-rating).

So if you buy a stock with an initial yield of 3%, expect the payout to grow at 7% annualized, and expect no change in the P/E, you can reasonably estimate that your long-term return from the investment will be 10%.

To show how this relationship holds up, consider the return components of the S&P 500 between 1996 and 2011:


Source: Aswath Damodaran data; rates are annualized.

Eerily spot on, huh?

Great, but what does this mean? 

Keeping in mind the expected return equation of "dividend yield + dividend growth +/- PE change", if the current market is yielding 3% and average long-term market dividend growth rate is 5% (the S&P 500 annualized growth rate from 1960-2011) -- and assuming no re-rating -- the market's expected long-term return is 8%. 

If the stock you're researching in that same market has a yield of 14%, then, you need to be able to answer the variables for dividend growth and re-rating and why your expected return should be 600 basis points above the expected market return. 

There's probably a good reason for the discrepancy that can be explained through further research into the business. The odds are pretty strong that such a wide discrepancy  will revert to the market average somehow -- and it's likely to come from a negative dividend growth rate. A meaningful decrease in the P/E ratio is unlikely because a stock trading with a 14% yield probably trades with a single-digit P/E to start with. So again, we're left with a negative outlook on the dividend growth rate.

On the other hand, if you come across a stock yielding 5% in a 3% market, that's not quite as worrisome. It's possible, for example, that the long-term dividend growth rate will be 5% and -- assuming no re-rating -- the expected long term return will be 10%. It's much easier to find a stock that might be slightly underestimated by the market (in this case 100 basis points) than one that's being underestimated by 600 basis points.

Bottom line

It's natural for income-minded investors to get interested in high-yielding stocks, but it's important not to get greedy. The investor's thinking is normally something like "Well, if the company can even maintain that 8% or 10% payout for a few years, it'll be a nice win for me." The market, however, rarely gives away such easy returns and that 8% or 10% yield is probably telling you that the market doesn't think the dividend is sustainable. 

All this is to say...never forget rule #1 of dividend investing -- if a yield is too high to be true, it probably is.

Essential weekend reading:

Have a great weekend!

Best,

Todd


Sunday, April 15, 2012

How to Identify Dividend Prodigal Sons

Dividend Aristocrats...Dividend Achievers...Dividend Champions. We all know what type of companies are on those lists -- companies that have raised their dividends each year without fail for decades. There's certainly a lot to be said for those companies as they've obviously been doing something right and they almost assuredly have solid competitive advantages. In short, they're a passive dividend investor's dream...when they can be purchased for the right price.

The problem is that investor assets have flooded into dividend-focused ETFs that own these type of stocks. For instance, the SPDR S&P US Dividend Aristocrats ETF raised almost $100m days after it launched...in Europe.

As a result of this heightened investor interest in dividend-paying stocks with impeccable track records, the cream-of-the crop stocks may not be great buys right now. Instead, if you're seeking dividend-paying stocks that have a better chance of being undervalued right now, you should also consider looking into dividend-paying stocks that I'll call "prodigal sons". These are stocks that once had sterling dividend track records but fell from grace during the financial crisis by cutting their payouts and are now in the process of rebuilding their dividend reputation.

Hundreds of companies cut their payouts during the financial crisis, but not all of them cut for the same reasons. Some were forced to by regulators (big banks), some levered up and made silly acquisitions at the wrong time, and some simply got caught paying out more than they could afford. The fact that they cut their payouts shouldn't be forgotten, but they shouldn't be written off completely, either. Some of them may be back on the road to redemption.

But how do we begin to separate the Prodigal Sons from the repeat offenders?

First, determine why the company cut its dividend during the financial crisis. Take a look at its financial statements in 2008 and 2009 and read the press release and management comments surrounding the dividend cut announcement. Did the company have the financial resources to continue paying and opportunistically seized the opportunity to reset its payout to a less burdensome level? Did it make some big investments at the wrong time that -- in hindsight -- put the company in a tough spot going into the recession? In some cases, companies should be let off the hook a bit for making the right investments at the wrong time.

Who was running the company when the cuts were announced? Is it the same team today? If it's the same team, look to see if they've learned their lesson -- look for cost cuts, an improved balance sheet, a more focused growth strategy, better returns on capital and equity, and renewed dividend hikes since the nadir. If the team has changed, what is their strategy and how does the dividend fit into it?

Has the company explicitly addressed the future of its dividend? If the company has realigned its dividend policy to be more sustainable (a lower payout ratio/higher cover), that's a positive sign. A company that's hiked its dividend each year since the cut is another encouraging sign. Look for management's comments on the dividend in conference call transcripts and in annual reports. Companies often address their priorities for free cash flow in conference calls or investor presentations -- is the dividend one of the top priorities?

What was the company's dividend track record prior to the cut? A company that increased its payout for 15 years prior to the cut, for instance, likely means that the dividend is part of the corporate culture and management might be eager to regain its reputation as a steady payer.

All this is to say that some of the best longer-term dividend ideas right now might be found in the group of Prodigal Sons. They should be approached with caution and they'll take more research effort, but the payoffs may be worth it.

Best,

Todd